scanpy.pl.tracksplot#
- scanpy.pl.tracksplot(adata, var_names, groupby, *, use_raw=None, log=False, dendrogram=False, gene_symbols=None, var_group_positions=None, var_group_labels=None, layer=None, show=None, save=None, figsize=None, **kwds)[source]#
Compact plot of expression of a list of genes.
In this type of plot each var_name is plotted as a filled line plot where the y values correspond to the var_name values and x is each of the cells. Best results are obtained when using raw counts that are not log.
groupbyis required to sort and order the values using the respective group and should be a categorical value.- Parameters:
- adata
AnnData Annotated data matrix.
- var_names
str|Sequence[str] |Mapping[str,str|Sequence[str]] var_namesshould be a valid subset ofadata.var_names. Ifvar_namesis a mapping, then the key is used as label to group the values (seevar_group_labels). The mapping values should be sequences of validadata.var_names. In this case either coloring or ‘brackets’ are used for the grouping of var names depending on the plot. Whenvar_namesis a mapping, then thevar_group_labelsandvar_group_positionsare set.- groupby
str The key of the observation grouping to consider.
- use_raw
bool|None(default:None) Use
rawattribute ofadataif present.- log
bool(default:False) Plot on logarithmic axis.
- num_categories
Only used if groupby observation is not categorical. This value determines the number of groups into which the groupby observation should be subdivided.
- categories_order
Order in which to show the categories. Note: add_dendrogram or add_totals can change the categories order.
- figsize
tuple[float,float] |None(default:None) Figure size when
multi_panel=True. Otherwise thercParam['figure.figsize]value is used. Format is (width, height)- dendrogram
bool|str(default:False) If True or a valid dendrogram key, a dendrogram based on the hierarchical clustering between the
groupbycategories is added. The dendrogram information is computed usingscanpy.tl.dendrogram(). Iftl.dendrogramhas not been called previously the function is called with default parameters.- gene_symbols
str|None(default:None) Column name in
.varDataFrame that stores gene symbols. By defaultvar_namesrefer to the index column of the.varDataFrame. Setting this option allows alternative names to be used.- var_group_positions
Sequence[tuple[int,int]] |None(default:None) Use this parameter to highlight groups of
var_names. This will draw a ‘bracket’ or a color block between the given start and end positions. If the parametervar_group_labelsis set, the corresponding labels are added on top/left. E.g.var_group_positions=[(4,10)]will add a bracket between the fourthvar_nameand the tenthvar_name. By giving more positions, more brackets/color blocks are drawn.- var_group_labels
Sequence[str] |None(default:None) Labels for each of the
var_group_positionsthat want to be highlighted.- var_group_rotation
Label rotation degrees. By default, labels larger than 4 characters are rotated 90 degrees.
- layer
str|None(default:None) Name of the AnnData object layer that wants to be plotted. By default adata.raw.X is plotted. If
use_raw=Falseis set, thenadata.Xis plotted. Iflayeris set to a valid layer name, then the layer is plotted.layertakes precedence overuse_raw.- show
bool|None(default:None) Show the plot, do not return axis.
- save
str|bool|None(default:None) If
Trueor astr, save the figure. A string is appended to the default filename. Infer the filetype if ending on {'.pdf','.png','.svg'}. (deprecated in favour ofsc.pl.plot(show=False).figure.savefig()).- ax
A matplotlib axes object. Only works if plotting a single component.
- **kwds
Are passed to
heatmap().
- adata
- Return type:
- Returns:
A list of
Axes.
Examples
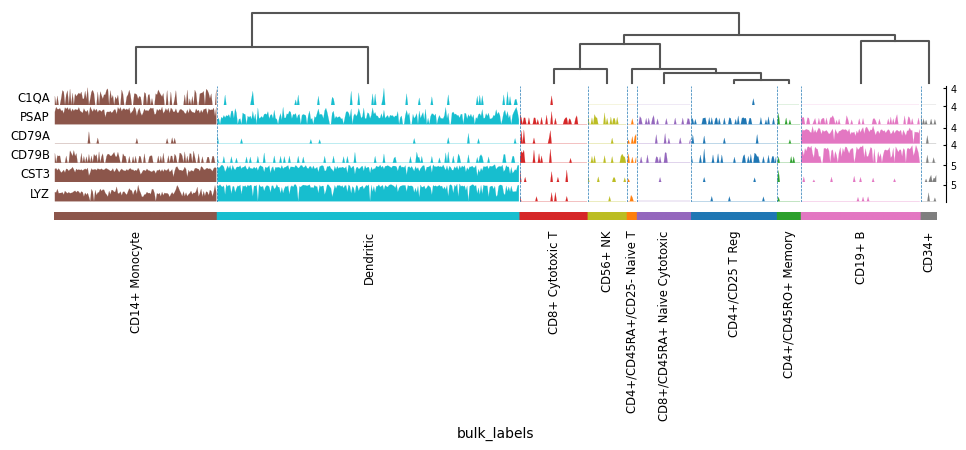
Using var_names as list:
import scanpy as sc
adata = sc.datasets.pbmc68k_reduced()
markers = ['C1QA', 'PSAP', 'CD79A', 'CD79B', 'CST3', 'LYZ']
sc.pl.tracksplot(adata, markers, groupby='bulk_labels', dendrogram=True)
WARNING: dendrogram data not found (using key=dendrogram_bulk_labels). Running `sc.tl.dendrogram` with default parameters. For fine tuning it is recommended to run `sc.tl.dendrogram` independently.
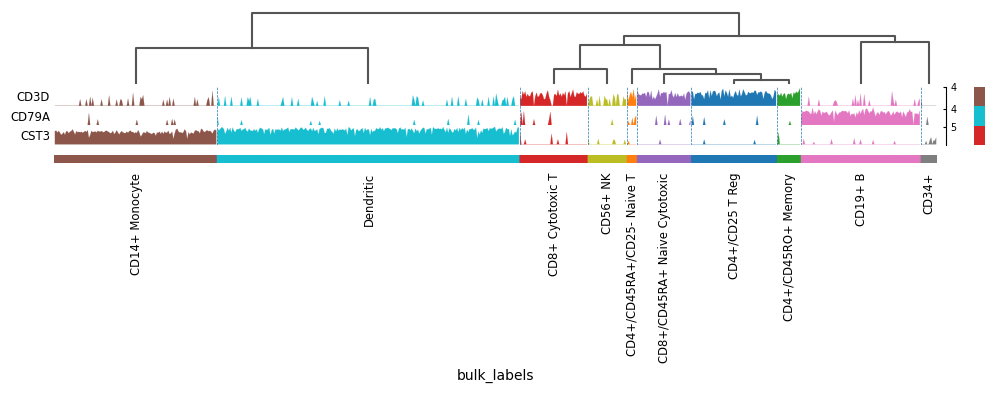
Using var_names as dict:
markers = {'T-cell': 'CD3D', 'B-cell': 'CD79A', 'myeloid': 'CST3'}
sc.pl.tracksplot(adata, markers, groupby='bulk_labels', dendrogram=True)
WARNING: Groups are not reordered because the `groupby` categories and the `var_group_labels` are different.
categories: CD4+/CD25 T Reg, CD4+/CD45RA+/CD25- Naive T, CD4+/CD45RO+ Memory, etc.
var_group_labels: T-cell, B-cell, myeloid
See also
pl.rank_genes_groups_tracksplotto plot marker genes identified using the
rank_genes_groups()function.