scanpy.pl.correlation_matrix#
- scanpy.pl.correlation_matrix(adata, groupby, *, show_correlation_numbers=False, dendrogram=None, figsize=None, show=None, save=None, ax=None, vmin=None, vmax=None, vcenter=None, norm=None, **kwds)[source]#
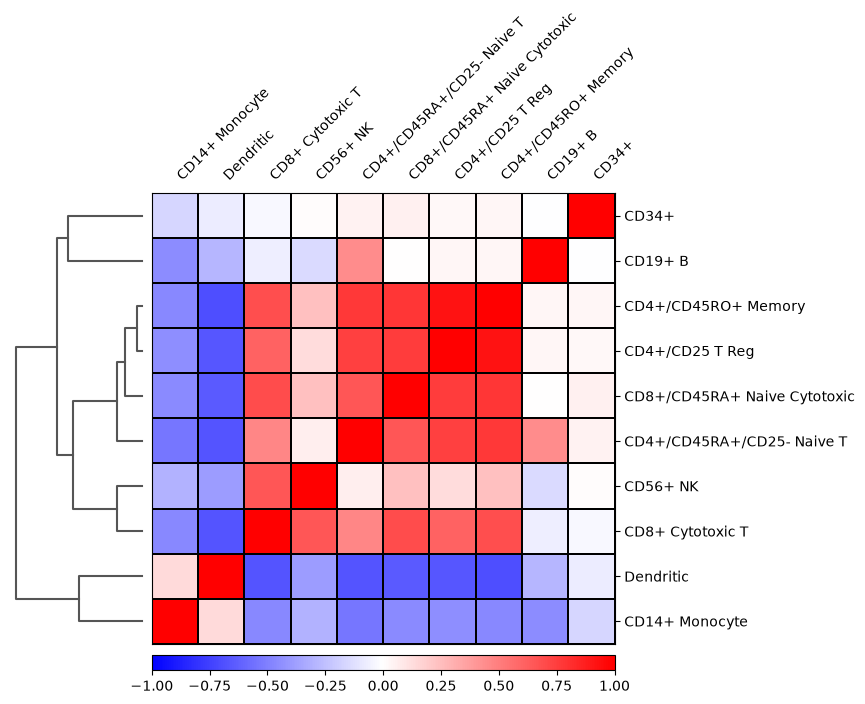
Plot the correlation matrix computed as part of
scanpy.tl.dendrogram().- Parameters:
- adata
AnnData - groupby
str Categorical data column used to create the dendrogram
- show_correlation_numbers
bool(default:False) If
show_correlation=True, plot the correlation on top of each cell.- dendrogram
bool|str|None(default:None) If True or a valid dendrogram key, a dendrogram based on the hierarchical clustering between the
groupbycategories is added. The dendrogram is computed usingscanpy.tl.dendrogram(). Iftl.dendrogramhas not been called previously, the function is called with default parameters.- figsize
tuple[float,float] |None(default:None) By default a figure size that aims to produce a squared correlation matrix plot is used. Format is (width, height)
- show
bool|None(default:None) Show the plot, do not return axis.
- save
str|bool|None(default:None) If
Trueor astr, save the figure. A string is appended to the default filename. Infer the filetype if ending on {'.pdf','.png','.svg'}. (deprecated in favour ofsc.pl.plot(show=False).figure.savefig()).- ax
Axes|None(default:None) A matplotlib axes object. Only works if plotting a single component.
- vmin
float|None(default:None) The value representing the lower limit of the color scale. Values smaller than vmin are plotted with the same color as vmin.
- vmax
float|None(default:None) The value representing the upper limit of the color scale. Values larger than vmax are plotted with the same color as vmax.
- vcenter
float|None(default:None) The value representing the center of the color scale. Useful for diverging colormaps.
- norm
Normalize|None(default:None) Custom color normalization object from matplotlib. See Colormap normalization for details.
- **kwds
Only if
show_correlationis True: Are passed tomatplotlib.pyplot.pcolormesh()when plotting the correlation heatmap.cmapcan be used to change the color palette.
- adata
- Return type:
- Returns:
If
show=False, returns a list ofmatplotlib.axes.Axesobjects.
Examples
Plot correlation matrix between cell type groups.
import scanpy as sc
adata = sc.datasets.pbmc68k_reduced()
sc.tl.dendrogram(adata, "bulk_labels")
sc.pl.correlation_matrix(adata, "bulk_labels")