scanpy.pl.rank_genes_groups_violin#
- scanpy.pl.rank_genes_groups_violin(adata, groups=None, *, n_genes=20, gene_names=None, gene_symbols=None, use_raw=None, key=None, split=True, density_norm='width', strip=True, jitter=True, size=1, ax=None, show=None, save=None, scale=density_norm)[source]#
Plot ranking of genes for all tested comparisons.
- Parameters:
- adata
AnnData Annotated data matrix.
- groups
Sequence[str] |None(default:None) List of group names.
- n_genes
int(default:20) Number of genes to show. Is ignored if
gene_namesis passed.- gene_names
Iterable[str] |None(default:None) List of genes to plot. Is only useful if interested in a custom gene list, which is not the result of
scanpy.tl.rank_genes_groups().- gene_symbols
str|None(default:None) Key for field in
.varthat stores gene symbols if you do not want to use.var_namesdisplayed in the plot.- use_raw
bool|None(default:None) Use
rawattribute ofadataif present. Defaults to the value that was used inrank_genes_groups().- split
bool(default:True) Whether to split the violins or not.
- density_norm
Literal['area','count','width'] (default:'width') See
violinplot().- strip
bool(default:True) Show a strip plot on top of the violin plot.
- jitter
float|bool(default:True) If set to 0, no points are drawn. See
stripplot().- size
int(default:1) Size of the jitter points.
- show
bool|None(default:None) Show the plot, do not return axis.
- save
bool|None(default:None) If
Trueor astr, save the figure. A string is appended to the default filename. Infer the filetype if ending on {'.pdf','.png','.svg'}. (deprecated in favour ofsc.pl.plot(show=False).figure.savefig()).- ax
Axes|None(default:None) A matplotlib axes object. Only works if plotting a single component.
- adata
Examples
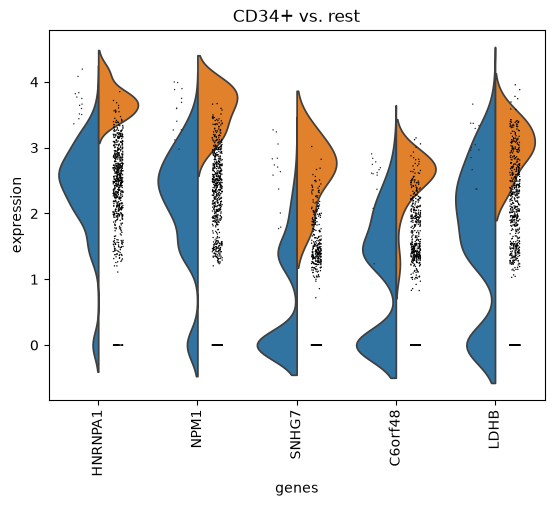
Plot violin distributions of top-ranked genes per group.
import scanpy as sc
adata = sc.datasets.pbmc68k_reduced()
sc.tl.rank_genes_groups(adata, "bulk_labels")
sc.pl.rank_genes_groups_violin(adata, groups=["CD34+"], n_genes=5)