scanpy.pl.highest_expr_genes#
- scanpy.pl.highest_expr_genes(adata, n_top=30, *, layer=None, gene_symbols=None, log=False, show=None, save=None, ax=None, **kwds)[source]#
Fraction of counts assigned to each gene over all cells.
Computes, for each gene, the fraction of counts assigned to that gene within a cell. The
n_topgenes with the highest mean fraction over all cells are plotted as boxplots.This plot is similar to the
scaterpackage functionplotHighestExprs(type = "highest-expression"), see here. Quoting from there:We expect to see the “usual suspects”, i.e., mitochondrial genes, actin, ribosomal protein, MALAT1. A few spike-in transcripts may also be present here, though if all of the spike-ins are in the top 50, it suggests that too much spike-in RNA was added. A large number of pseudo-genes or predicted genes may indicate problems with alignment. – Davis McCarthy and Aaron Lun
- Parameters:
- adata
AnnData Annotated data matrix.
- n_top
int(default:30) Number of top
- layer
str|None(default:None) Layer from which to pull data.
- gene_symbols
str|None(default:None) Key for field in .var that stores gene symbols if you do not want to use .var_names.
- log
bool(default:False) Plot x-axis in log scale
- show
bool|None(default:None) Show the plot, do not return axis.
- save
str|bool|None(default:None) If
Trueor astr, save the figure. A string is appended to the default filename. Infer the filetype if ending on {'.pdf','.png','.svg'}. (deprecated in favour ofsc.pl.plot(show=False).figure.savefig()).- ax
Axes|None(default:None) A matplotlib axes object. Only works if plotting a single component.
- **kwds
Are passed to
boxplot().
- adata
- Returns:
If
show==FalseaAxes.
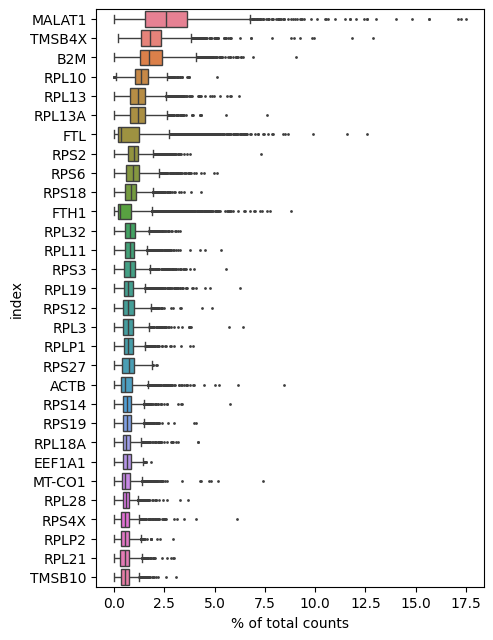
Examples
import scanpy as sc
adata = sc.datasets.pbmc3k()
sc.pl.highest_expr_genes(adata)
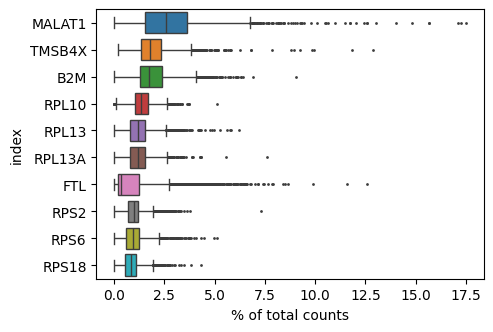
Show only the top 10 genes
sc.pl.highest_expr_genes(adata, n_top=10)