scanpy.pl.scatter#
- scanpy.pl.scatter(adata, x=None, y=None, *, color=None, use_raw=None, layers=None, sort_order=True, alpha=None, basis=None, groups=None, components=None, projection='2d', legend_loc='right margin', legend_fontsize=None, legend_fontweight=None, legend_fontoutline=None, color_map=None, palette=None, frameon=None, right_margin=None, left_margin=None, size=None, marker='.', title=None, show=None, ax=None, save=None)[source]#
Scatter plot along observations or variables axes.
Color the plot using annotations of observations (
.obs), variables (.var) or expression of genes (.var_names).- Parameters:
- adata
AnnData Annotated data matrix.
- x
str|None(default:None) x coordinate.
- y
str|None(default:None) y coordinate.
- color
str|str|tuple[float,float,float] |tuple[float,float,float,float] |Collection[str|str|tuple[float,float,float] |tuple[float,float,float,float]] |None(default:None) Keys for annotations of observations/cells or variables/genes, or a hex color specification, e.g.,
'ann1','#fe57a1', or['ann1', 'ann2'].- use_raw
bool|None(default:None) Whether to use
rawattribute ofadata. Defaults toTrueif.rawis present.- layers
str|Collection[str] |None(default:None) Use the
layersattribute ofadataif present: specify the layer forx,yandcolor. Iflayersis a string, then it is expanded to(layers, layers, layers).- basis
Literal['pca','tsne','umap','diffmap','draw_graph_fr'] |None(default:None) String that denotes a plotting tool that computed coordinates.
- sort_order
bool(default:True) For continuous annotations used as color parameter, plot data points with higher values on top of others.
- groups
str|Iterable[str] |None(default:None) Restrict to a few categories in categorical observation annotation. The default is not to restrict to any groups.
- dimensions
0-indexed dimensions of the embedding to plot as integers. E.g. [(0, 1), (1, 2)]. Unlike
components, this argument is used in the same way ascolors, e.g. is used to specify a single plot at a time. Will eventually replace the components argument.- components
str|Collection[str] |None(default:None) For instance,
['1,2', '2,3']. To plot all available components usecomponents='all'.- projection
Literal['2d','3d'] (default:'2d') Projection of plot (default:
'2d').- legend_loc
Literal['none','right margin','on data','on data export','best','upper right','upper left','lower left','lower right','right','center left','center right','lower center','upper center','center'] |None(default:'right margin') Location of legend, either
'on data','right margin',None, or a valid keyword for thelocparameter ofLegend.- legend_fontsize
float|Literal['xx-small','x-small','small','medium','large','x-large','xx-large'] |None(default:None) Numeric size in pt or string describing the size. See
set_fontsize().- legend_fontweight
int|Literal['light','normal','medium','semibold','bold','heavy','black'] |None(default:None) Legend font weight. A numeric value in range 0-1000 or a string. Defaults to
'bold'iflegend_loc == 'on data', otherwise to'normal'. Seeset_fontweight().- legend_fontoutline
float|None(default:None) Line width of the legend font outline in pt. Draws a white outline using the path effect
withStroke.- size
float|None(default:None) Point size. If
None, is automatically computed as 120000 / n_cells. Can be a sequence containing the size for each cell. The order should be the same as in adata.obs.- color_map
str|Colormap|None(default:None) Color map to use for continous variables. Can be a name or a
Colormapinstance (e.g."magma”,"viridis"ormpl.cm.cividis), seeget_cmap(). IfNone, the value ofmpl.rcParams["image.cmap"]is used. The defaultcolor_mapcan be set usingset_figure_params().- palette
Cycler|ListedColormap|str|tuple[float,float,float] |tuple[float,float,float,float] |Sequence[str|tuple[float,float,float] |tuple[float,float,float,float]] |None(default:None) Colors to use for plotting categorical annotation groups. The palette can be a valid
ListedColormapname ('Set2','tab20', …), aCyclerobject, a dict mapping categories to colors, or a sequence of colors. Colors must be valid to matplotlib. (seeis_color_like()). IfNone,mpl.rcParams["axes.prop_cycle"]is used unless the categorical variable already has colors stored inadata.uns["{var}_colors"]. If provided, values ofadata.uns["{var}_colors"]will be set.- frameon
bool|None(default:None) Draw a frame around the scatter plot. Defaults to value set in
set_figure_params(), defaults toTrue.- title
str|Collection[str] |None(default:None) Provide title for panels either as string or list of strings, e.g.
['title1', 'title2', ...].- show
bool|None(default:None) Show the plot, do not return axis.
- save
str|bool|None(default:None) If
Trueor astr, save the figure. A string is appended to the default filename. Infer the filetype if ending on {'.pdf','.png','.svg'}. (deprecated in favour ofsc.pl.plot(show=False).figure.savefig()).- ax
Axes|None(default:None) A matplotlib axes object. Only works if plotting a single component.
- adata
- Return type:
- Returns:
If
show==FalseaAxesor a list of it.
Examples
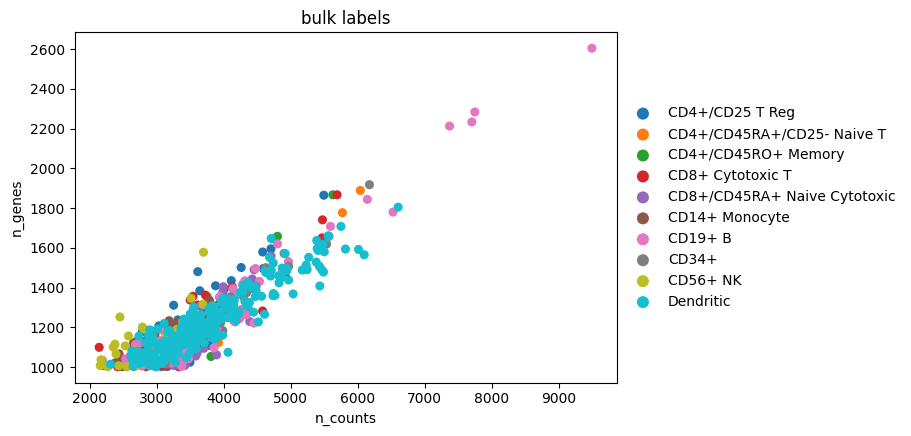
Plot two
.obsannotations against each other and colour by a third.import scanpy as sc adata = sc.datasets.pbmc68k_reduced() sc.pl.scatter(adata, x="n_counts", y="n_genes", color="bulk_labels")
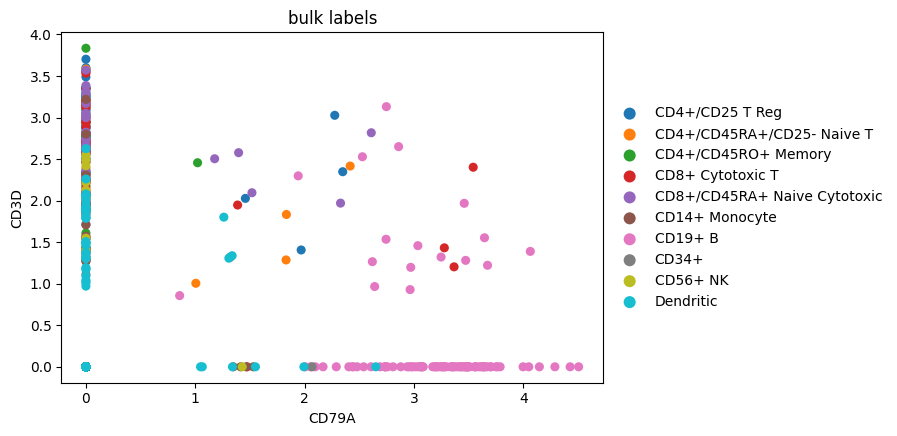
Plot expression of two genes against each other.
sc.pl.scatter(adata, x="CD79A", y="CD3D", color="bulk_labels")
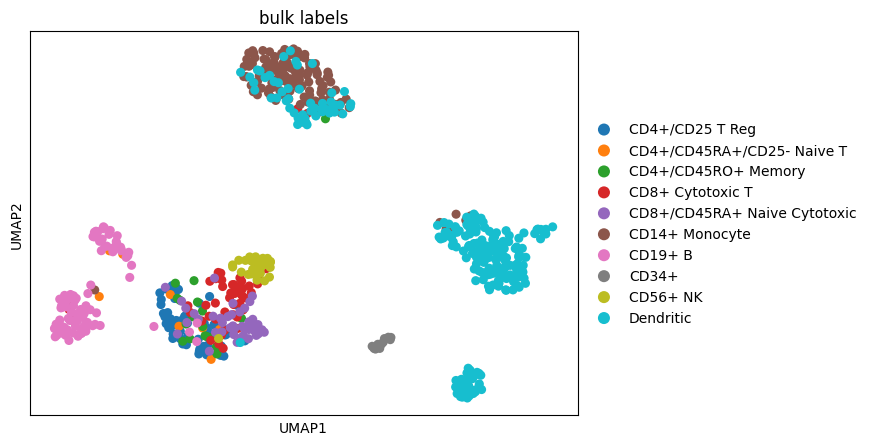
Use a precomputed embedding via the
basisargument.sc.pl.scatter(adata, basis="umap", color="bulk_labels")