scanpy.pl.rank_genes_groups_dotplot#
- scanpy.pl.rank_genes_groups_dotplot(adata, groups=None, *, n_genes=None, groupby=None, values_to_plot=None, var_names=None, gene_symbols=None, min_logfoldchange=None, key=None, show=None, return_fig=False, save=None, **kwds)[source]#
Plot ranking of genes using dotplot plot (see
dotplot()).- Parameters:
- adata
AnnData Annotated data matrix.
- groups
str|Sequence[str] |None(default:None) The groups for which to show the gene ranking.
- n_genes
int|None(default:None) Number of genes to show. This can be a negative number to show for example the down regulated genes. eg: num_genes=-10. Is ignored if
gene_namesis passed.- gene_symbols
str|None(default:None) Column name in
.varDataFrame that stores gene symbols. By defaultvar_namesrefer to the index column of the.varDataFrame. Setting this option allows alternative names to be used.- groupby
str|None(default:None) The key of the observation grouping to consider. By default, the groupby is chosen from the rank genes groups parameter but other groupby options can be used. It is expected that groupby is a categorical. If groupby is not a categorical observation, it would be subdivided into
num_categories(seedotplot()).- min_logfoldchange
float|None(default:None) Value to filter genes in groups if their logfoldchange is less than the min_logfoldchange
- key
str|None(default:None) Key used to store the ranking results in
adata.uns.- values_to_plot
Literal['scores','logfoldchanges','pvals','pvals_adj','log10_pvals','log10_pvals_adj'] |None(default:None) Instead of the mean gene value, plot the values computed by
sc.rank_genes_groups. The options are: [‘scores’, ‘logfoldchanges’, ‘pvals’, ‘pvals_adj’, ‘log10_pvals’, ‘log10_pvals_adj’]. When plotting logfoldchanges a divergent colormap is recommended. See examples below.- var_names
Sequence[str] |Mapping[str,Sequence[str]] |None(default:None) Genes to plot. Sometimes is useful to pass a specific list of var names (e.g. genes) to check their fold changes or p-values, instead of the top/bottom genes. The var_names could be a dictionary or a list as in
dotplot()ormatrixplot(). See examples below.- show
bool|None(default:None) Show the plot, do not return axis.
- save
bool|None(default:None) If
Trueor astr, save the figure. A string is appended to the default filename. Infer the filetype if ending on {'.pdf','.png','.svg'}. (deprecated in favour ofsc.pl.plot(show=False).figure.savefig()).- ax
A matplotlib axes object. Only works if plotting a single component.
- return_fig
bool(default:False) Returns
DotPlotobject. Useful for fine-tuning the plot. Takes precedence overshow=False.- **kwds
Are passed to
dotplot().
- adata
- Returns:
If
return_figisTrue, returns aDotPlotobject, else ifshowis false, return axes dict
Examples
import scanpy as sc
adata = sc.datasets.pbmc68k_reduced()
sc.tl.rank_genes_groups(adata, 'bulk_labels', n_genes=adata.raw.shape[1])
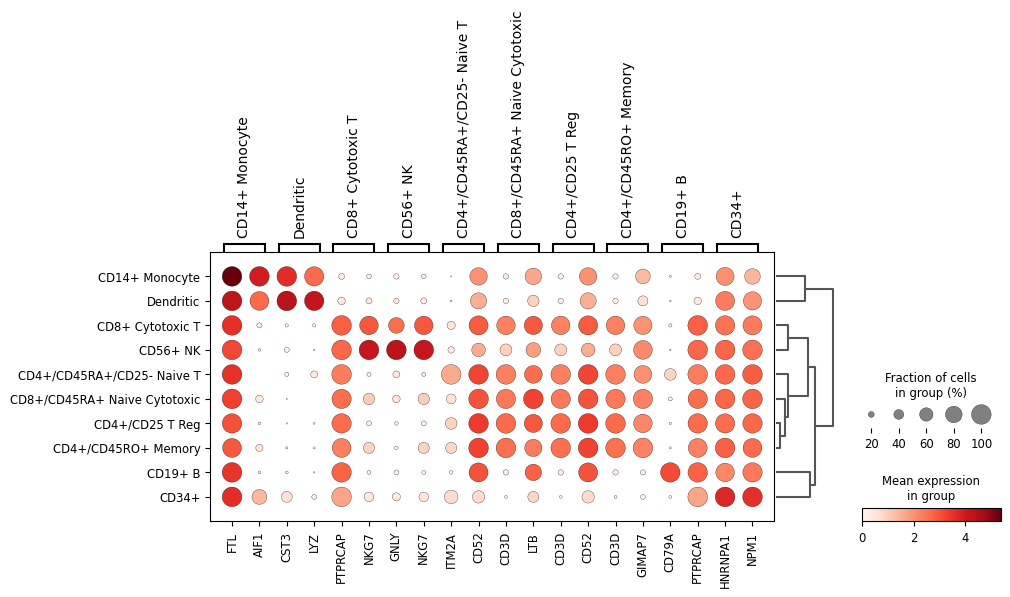
Plot top 2 genes per group.
sc.pl.rank_genes_groups_dotplot(adata,n_genes=2)
WARNING: dendrogram data not found (using key=dendrogram_bulk_labels). Running `sc.tl.dendrogram` with default parameters. For fine tuning it is recommended to run `sc.tl.dendrogram` independently.
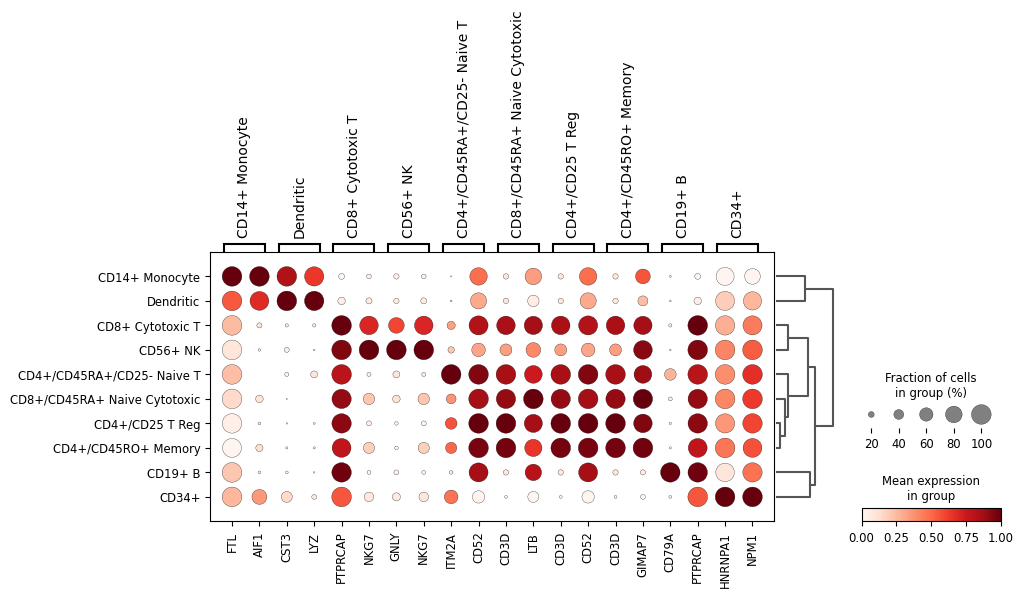
Plot with scaled expressions for easier identification of differences.
sc.pl.rank_genes_groups_dotplot(adata, n_genes=2, standard_scale='var')
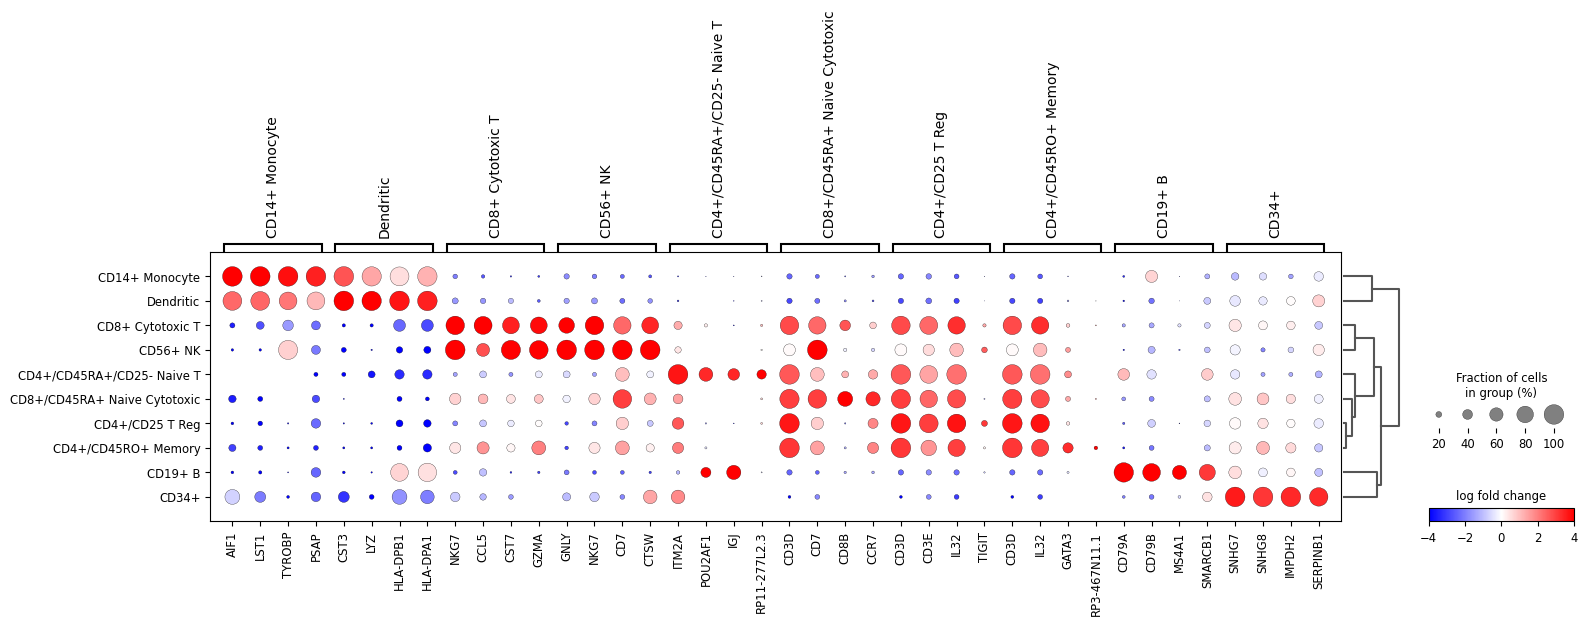
Plot
logfoldchangesinstead of gene expression. In this case a diverging colormap likebwrorseismicworks better. To center the colormap in zero, the minimum and maximum values to plot are set to -4 and 4 respectively. Also, only genes with a log fold change of 3 or more are shown.sc.pl.rank_genes_groups_dotplot( adata, n_genes=4, values_to_plot="logfoldchanges", cmap='bwr', vmin=-4, vmax=4, min_logfoldchange=3, colorbar_title='log fold change' )
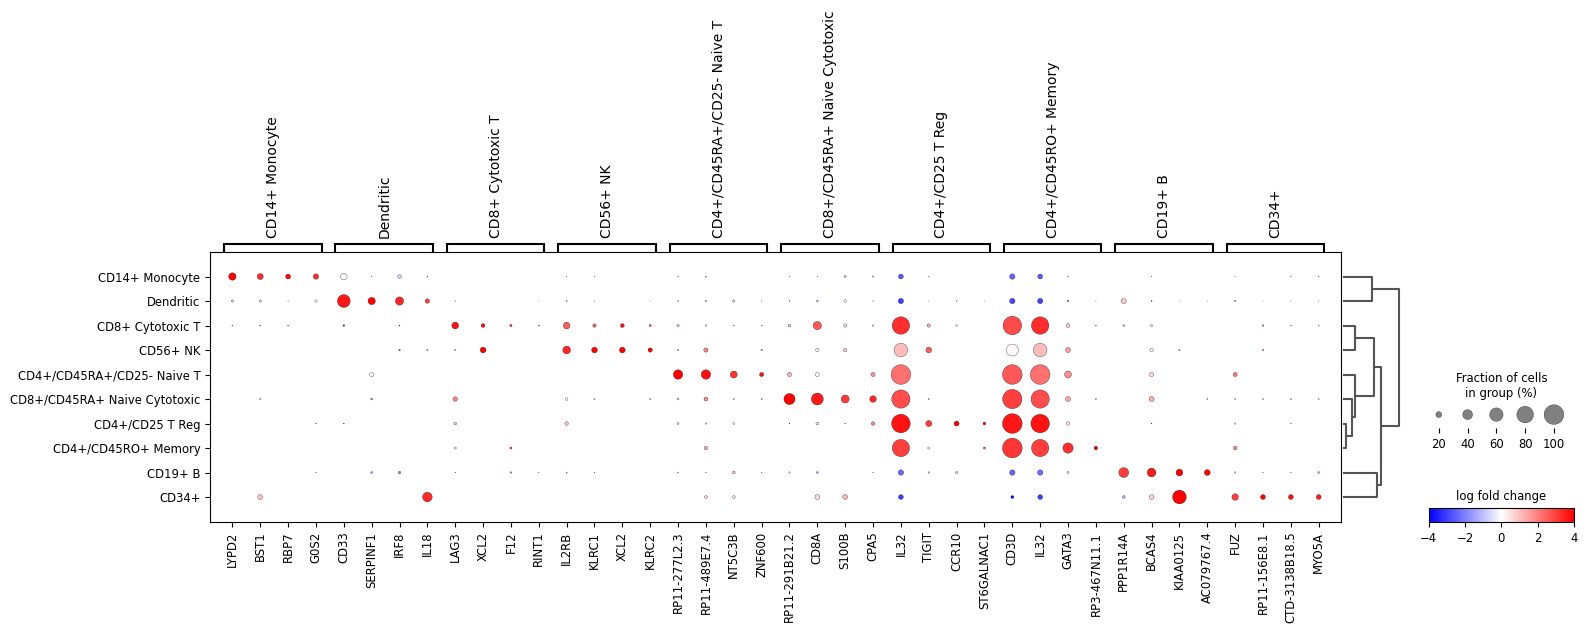
Also, the last genes can be plotted. This can be useful to identify genes that are lowly expressed in a group. For this
n_genes=-4is usedsc.pl.rank_genes_groups_dotplot( adata, n_genes=-4, values_to_plot="logfoldchanges", cmap='bwr', vmin=-4, vmax=4, min_logfoldchange=3, colorbar_title='log fold change', )
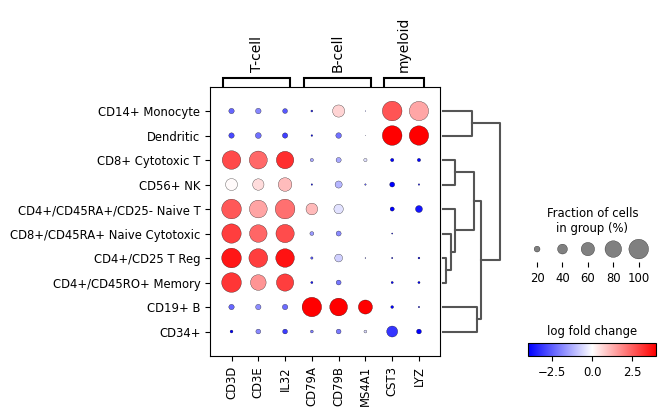
A list specific genes can be given to check their log fold change. If a dictionary, the dictionary keys will be added as labels in the plot.
var_names = {'T-cell': ['CD3D', 'CD3E', 'IL32'],
              'B-cell': ['CD79A', 'CD79B', 'MS4A1'],
              'myeloid': ['CST3', 'LYZ'] }
sc.pl.rank_genes_groups_dotplot(
    adata,
    var_names=var_names,
    values_to_plot="logfoldchanges",
    cmap='bwr',
    vmin=-4,
    vmax=4,
    min_logfoldchange=3,
    colorbar_title='log fold change',
)
WARNING: Groups are not reordered because the `groupby` categories and the `var_group_labels` are different.
categories: CD4+/CD25 T Reg, CD4+/CD45RA+/CD25- Naive T, CD4+/CD45RO+ Memory, etc.
var_group_labels: T-cell, B-cell, myeloid
See also