scanpy.pl.rank_genes_groups_heatmap#
- scanpy.pl.rank_genes_groups_heatmap(adata, groups=None, *, n_genes=None, groupby=None, gene_symbols=None, var_names=None, min_logfoldchange=None, key=None, show=None, save=None, **kwds)[source]#
Plot ranking of genes using heatmap plot (see
heatmap()).- Parameters:
- adata
AnnData Annotated data matrix.
- groups
str|Sequence[str] |None(default:None) The groups for which to show the gene ranking.
- n_genes
int|None(default:None) Number of genes to show. This can be a negative number to show for example the down regulated genes. eg: num_genes=-10. Is ignored if
gene_namesis passed.- gene_symbols
str|None(default:None) Column name in
.varDataFrame that stores gene symbols. By defaultvar_namesrefer to the index column of the.varDataFrame. Setting this option allows alternative names to be used.- groupby
str|None(default:None) The key of the observation grouping to consider. By default, the groupby is chosen from the rank genes groups parameter but other groupby options can be used. It is expected that groupby is a categorical. If groupby is not a categorical observation, it would be subdivided into
num_categories(seedotplot()).- min_logfoldchange
float|None(default:None) Value to filter genes in groups if their logfoldchange is less than the min_logfoldchange
- key
str|None(default:None) Key used to store the ranking results in
adata.uns.- show
bool|None(default:None) Show the plot, do not return axis.
- save
bool|None(default:None) If
Trueor astr, save the figure. A string is appended to the default filename. Infer the filetype if ending on {'.pdf','.png','.svg'}. (deprecated in favour ofsc.pl.plot(show=False).figure.savefig()).- ax
A matplotlib axes object. Only works if plotting a single component.
- **kwds
Are passed to
heatmap().
- adata
Examples
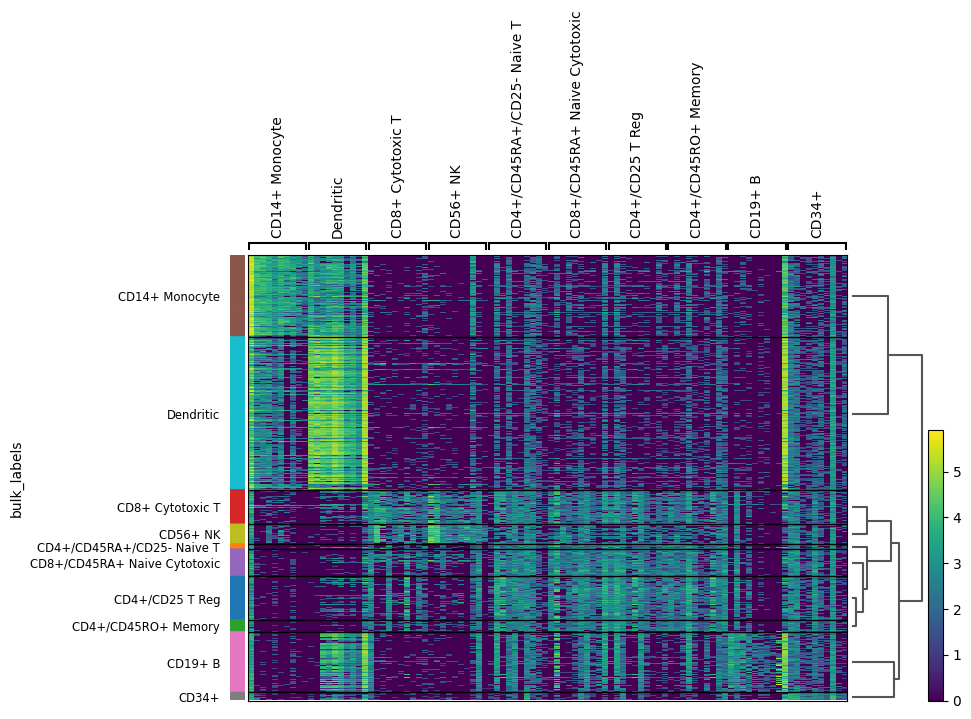
import scanpy as sc
adata = sc.datasets.pbmc68k_reduced()
sc.tl.rank_genes_groups(adata, 'bulk_labels')
sc.pl.rank_genes_groups_heatmap(adata)
WARNING: dendrogram data not found (using key=dendrogram_bulk_labels). Running `sc.tl.dendrogram` with default parameters. For fine tuning it is recommended to run `sc.tl.dendrogram` independently.
WARNING: Gene labels are not shown when more than 50 genes are visualized. To show gene labels set `show_gene_labels=True`
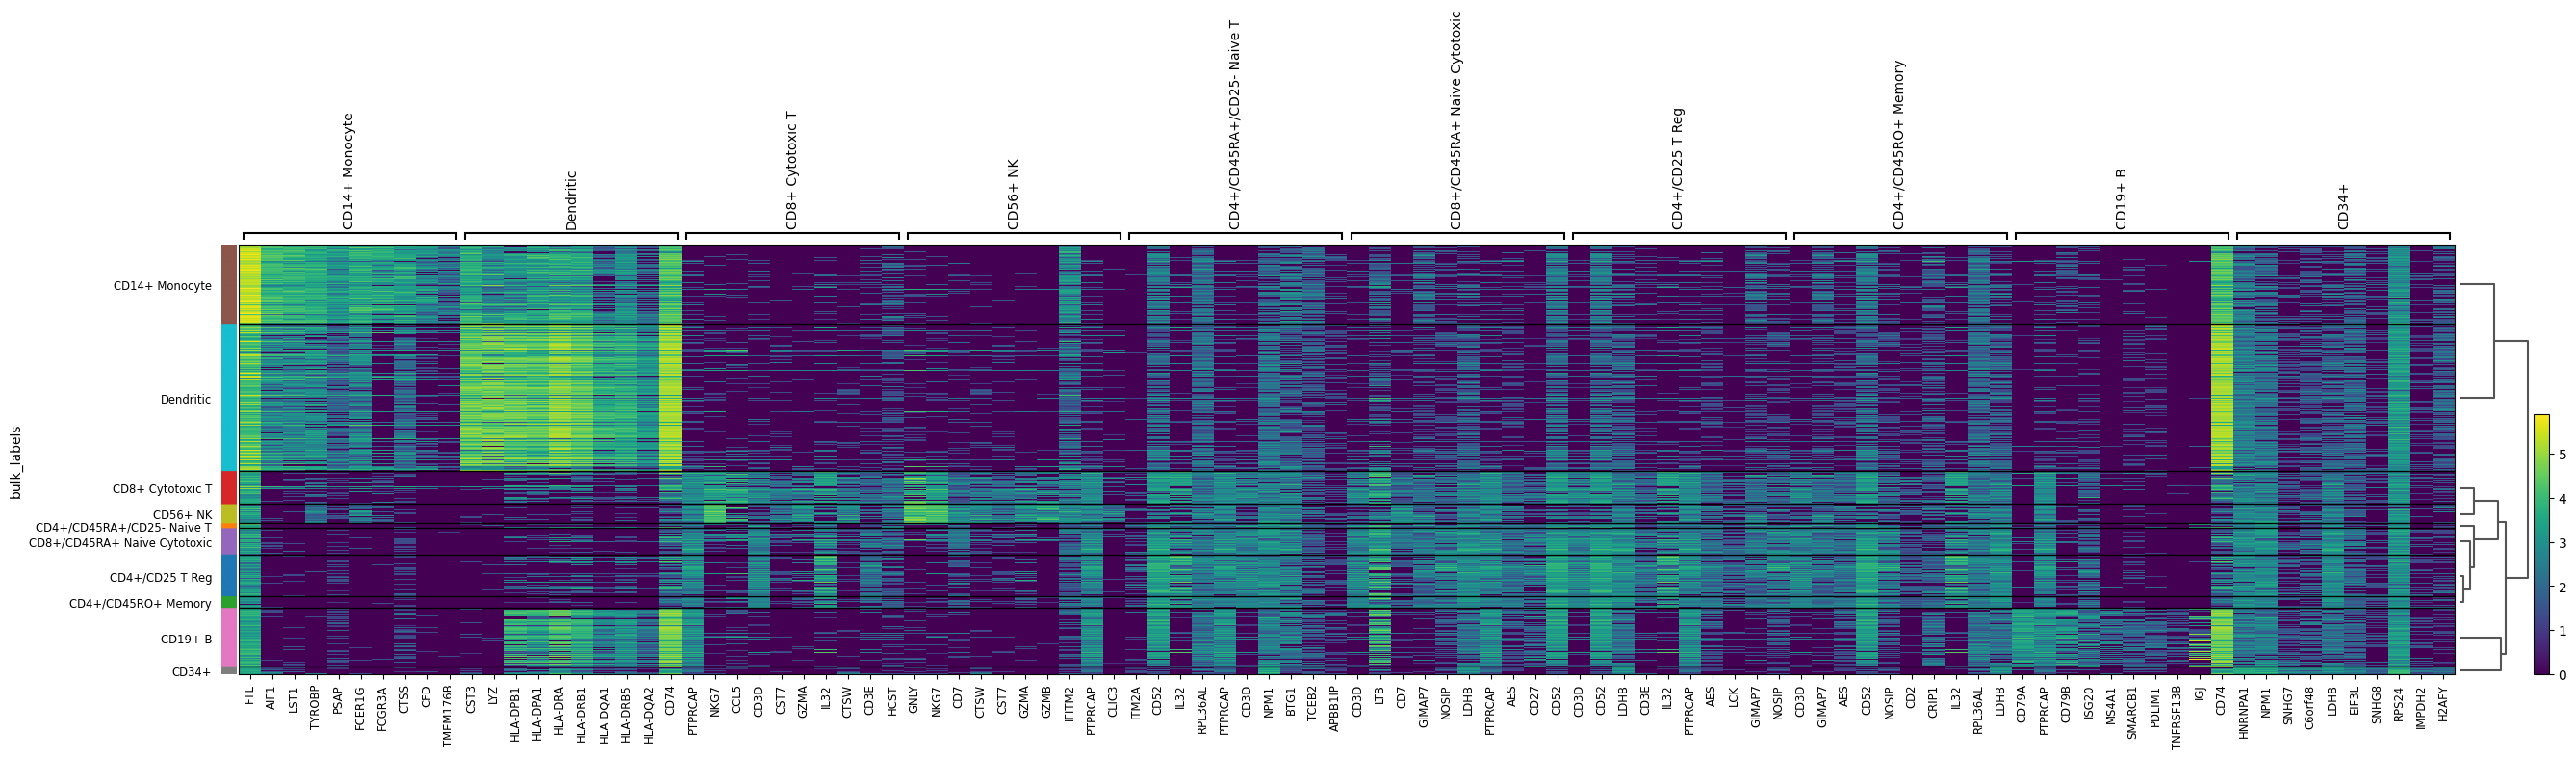
Show gene names per group on the heatmap
sc.pl.rank_genes_groups_heatmap(adata, show_gene_labels=True)
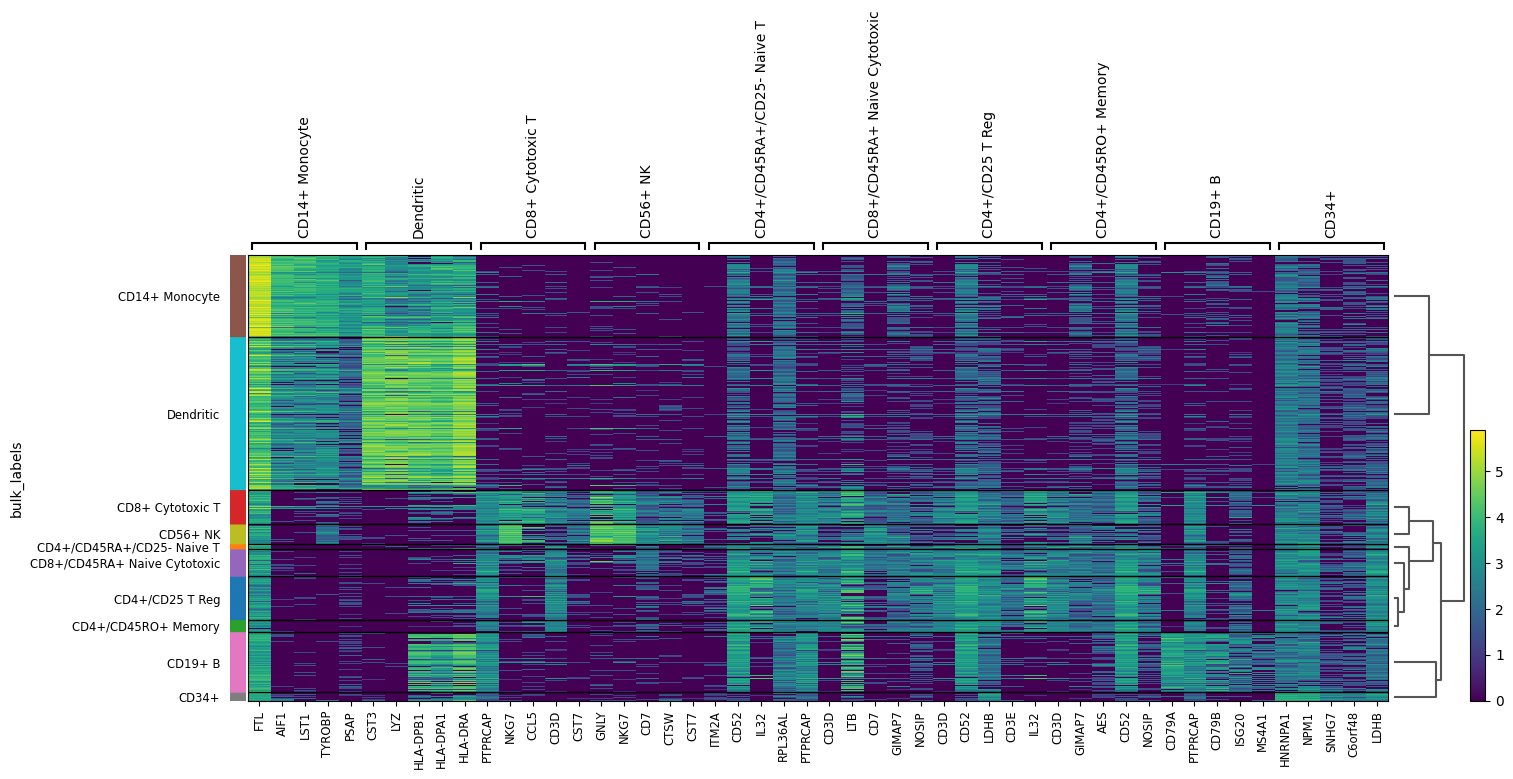
Plot top 5 genes per group (default 10 genes)
sc.pl.rank_genes_groups_heatmap(adata, n_genes=5, show_gene_labels=True)
See also