scanpy.pl.pca_loadings#
- scanpy.pl.pca_loadings(adata, components=None, *, include_lowest=True, n_points=None, show=None, save=None)[source]#
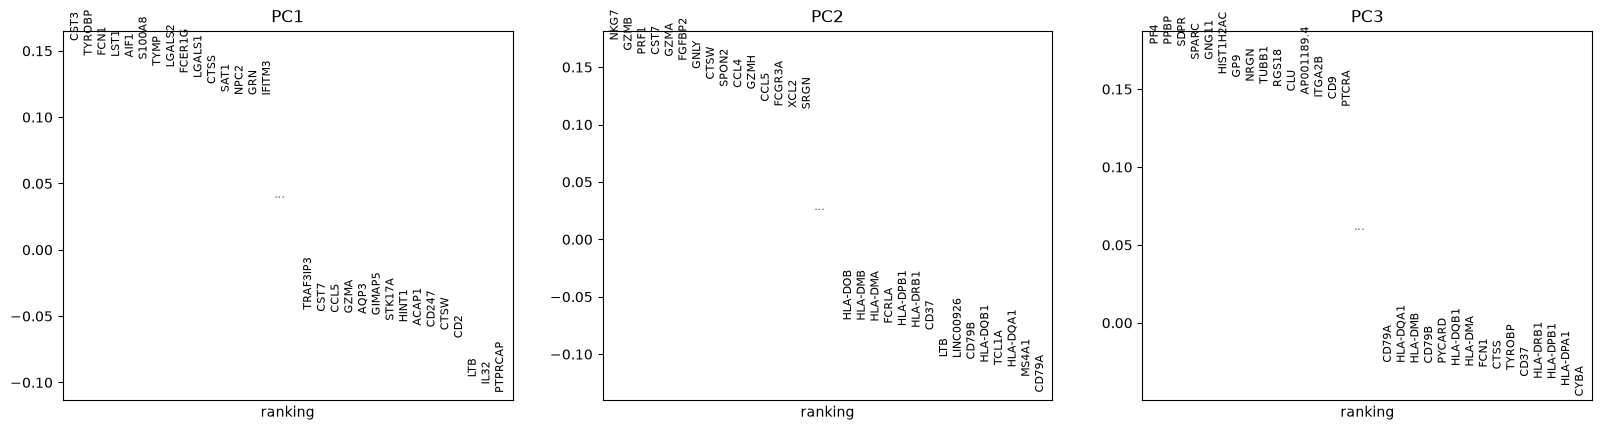
Rank genes according to contributions to PCs.
- Parameters:
- adata
AnnData Annotated data matrix.
- components
str|Sequence[int] |None(default:None) For example,
'1,2,3'means[1, 2, 3], first, second, third principal component.- include_lowest
bool(default:True) Whether to show the variables with both highest and lowest loadings.
- show
bool|None(default:None) Show the plot, do not return axis.
- n_points
int|None(default:None) Number of variables to plot for each component.
- save
str|bool|None(default:None) If
Trueor astr, save the figure. A string is appended to the default filename. Infer the filetype if ending on {'.pdf','.png','.svg'}.
- adata
Examples
import scanpy as sc
adata = sc.datasets.pbmc3k_processed()
Show first 3 components loadings
sc.pl.pca_loadings(adata, components = '1,2,3')