scanpy.pl.pca_variance_ratio#
- scanpy.pl.pca_variance_ratio(adata, n_pcs=30, *, log=False, show=None, save=None)[source]#
Plot the variance ratio.
- Parameters:
- n_pcs
int(default:30) Number of PCs to show.
- log
bool(default:False) Plot on logarithmic scale..
- show
bool|None(default:None) Show the plot, do not return axis.
- save
bool|str|None(default:None) If
Trueor astr, save the figure. A string is appended to the default filename. Infer the filetype if ending on {'.pdf','.png','.svg'}.
- n_pcs
Examples
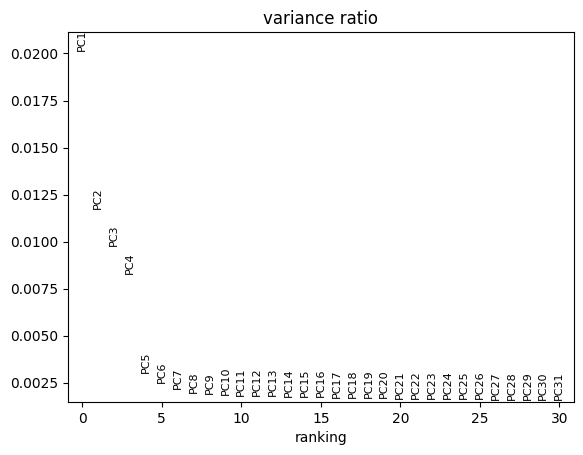
Plot the variance ratio for the first 30 PCs.
import scanpy as sc
adata = sc.datasets.pbmc3k_processed()
sc.pl.pca_variance_ratio(adata)
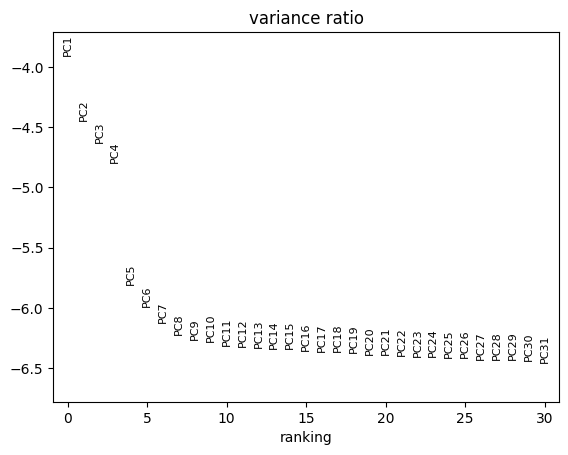
Plot on a logarithmic scale.
sc.pl.pca_variance_ratio(adata, log=True)