scanpy.pl.ranking#
Note
Both backends are accessible as scanpy.pl.ranking.
The active backend is chosen by scanpy.settings.preset:
the default is the legacy matplotlib backend;
set it to scanpy.Preset.ScanpyV2Preview to use the HoloViews backend.
- scanpy.plotting._v2.ranking(adata, ref, /, n_points=10, *, include_lowest=True, label_dim=None)[source]
Plot (e.g. PCA) score ranking.
- Parameters:
- adata
AnnData Annotated data matrix.
- ref
AdDim Dimension containing scores to rank.
- n_points
int(default:10) Number of points to plot.
- include_lowest
bool(default:True) Whether to include the lowest-scored names in addition to the highest-scored ones.
- label_dim
AdDim|None(default:None) Dimension to use for labels. The default is
dim’s axis index (e.g.A.obs.indexforA.obs["scores"]).
- adata
- Return type:
- Returns:
Holoviews plot with labels and points.
Examples
Rank genes by their loading on a principal component (replaces the legacy
pca_loadings()):import scanpy as sc import holoviews as hv sc.settings.preset = sc.Preset.ScanpyV2Preview A = sc.pl.hv_init('bokeh') adata = sc.datasets.pbmc68k_reduced() hv.Layout([ sc.pl.ranking(adata, A.varm["PCs"][0]).opts(aspect=1.2), sc.pl.ranking(adata, A.varm["PCs"][0], include_lowest=False).opts(aspect=0.6), ]).opts(shared_axes=False)import scanpy as sc import holoviews as hv sc.settings.preset = sc.Preset.ScanpyV2Preview A = sc.pl.hv_init('matplotlib') adata = sc.datasets.pbmc68k_reduced() hv.Layout([ sc.pl.ranking(adata, A.varm["PCs"][0]).opts(aspect=1.2), sc.pl.ranking(adata, A.varm["PCs"][0], include_lowest=False).opts(aspect=0.6), ]).opts(shared_axes=False)WARNING:param.main: Option 'angle' for Labels type not valid for selected backend ('matplotlib'). Option only applies to following backends: ['bokeh'] WARNING:param.main: Option 'text_align' for Labels type not valid for selected backend ('matplotlib'). Option only applies to following backends: ['bokeh'] WARNING:param.main: Option 'angle' for Labels type not valid for selected backend ('matplotlib'). Option only applies to following backends: ['bokeh'] WARNING:param.main: Option 'text_align' for Labels type not valid for selected backend ('matplotlib'). Option only applies to following backends: ['bokeh']
import scanpy as sc
import holoviews as hv

sc.settings.preset = sc.Preset.ScanpyV2Preview
A = sc.pl.hv_init('plotly')

adata = sc.datasets.pbmc68k_reduced()
hv.Layout([
    sc.pl.ranking(adata, A.varm["PCs"][0]).opts(aspect=1.2),
    sc.pl.ranking(adata, A.varm["PCs"][0], include_lowest=False).opts(aspect=0.6),
]).opts(shared_axes=False)
WARNING:param.main: Option 'angle' for Labels type not valid for selected backend ('plotly'). Option only applies to following backends: ['bokeh'] WARNING:param.main: Option 'text_align' for Labels type not valid for selected backend ('plotly'). Option only applies to following backends: ['bokeh'] WARNING:param.main: Option 'angle' for Labels type not valid for selected backend ('plotly'). Option only applies to following backends: ['bokeh'] WARNING:param.main: Option 'text_align' for Labels type not valid for selected backend ('plotly'). Option only applies to following backends: ['bokeh']Rank principal components by their explained variance ratio (replaces the legacy
pca_variance_ratio()), usingpca()to expose it as a.varcolumn:pca_adata = sc.get.pca(adata) sc.pl.ranking(pca_adata, A.var["variance_ratio"], include_lowest=False)
pca_adata = sc.get.pca(adata)
sc.pl.ranking(pca_adata, A.var["variance_ratio"], include_lowest=False)
WARNING:param.main: Option 'angle' for Labels type not valid for selected backend ('matplotlib'). Option only applies to following backends: ['bokeh'] WARNING:param.main: Option 'text_align' for Labels type not valid for selected backend ('matplotlib'). Option only applies to following backends: ['bokeh']
pca_adata = sc.get.pca(adata)
sc.pl.ranking(pca_adata, A.var["variance_ratio"], include_lowest=False)
WARNING:param.main: Option 'angle' for Labels type not valid for selected backend ('plotly'). Option only applies to following backends: ['bokeh']
WARNING:param.main: Option 'text_align' for Labels type not valid for selected backend ('plotly'). Option only applies to following backends: ['bokeh']
- scanpy.pl.ranking(adata, attr, keys, *, dictionary=None, indices=None, labels=None, color='black', n_points=30, log=False, include_lowest=False, show=None)[source]#
Plot rankings.
See, for example, how this is used in pl.pca_loadings.
- Parameters:
- Return type:
- Returns:
Returns matplotlib gridspec with access to the axes.
Examples
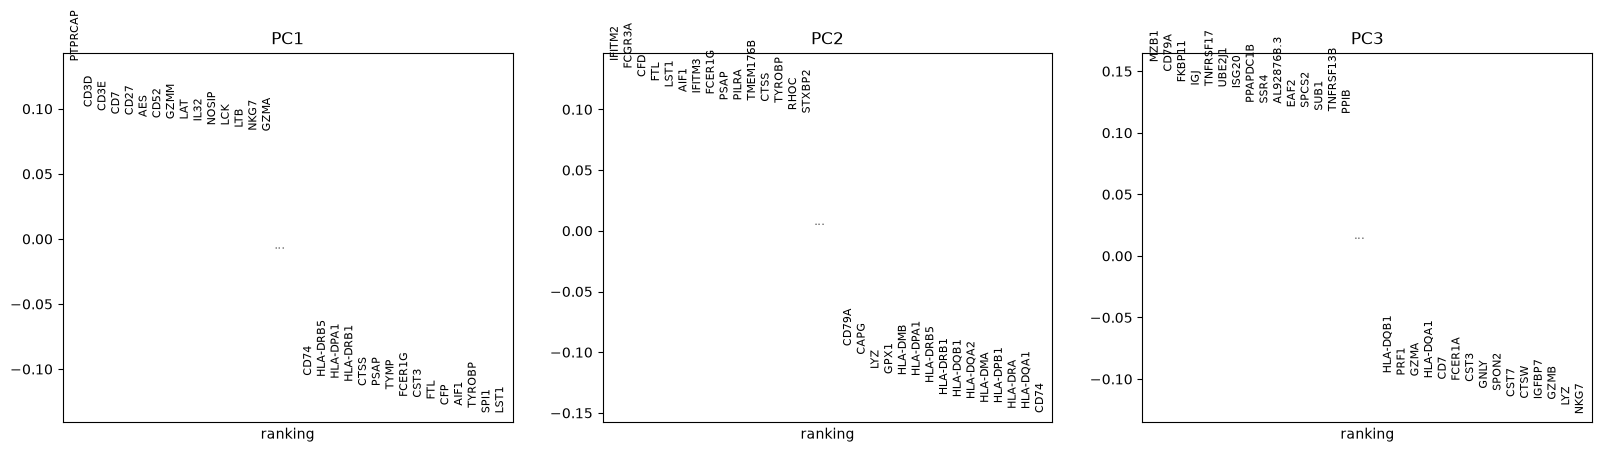
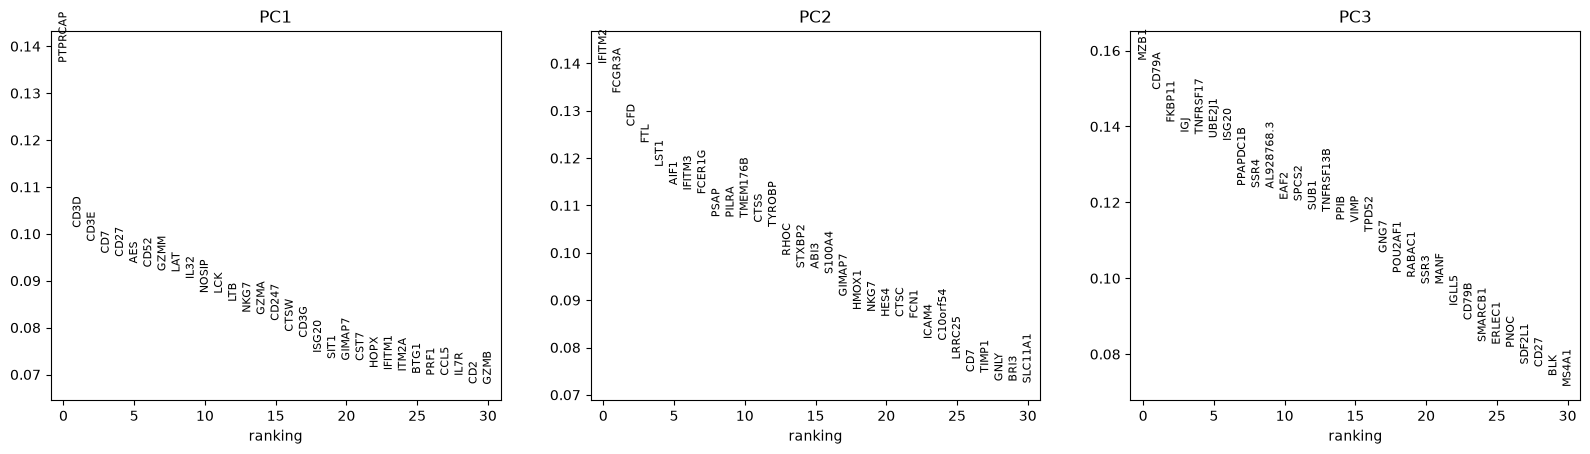
Show the genes with the highest loading on the first three principal components. PCA in
pbmc68k_reduced()was computed on highly-variable genes only, so we subset to those genes before ranking.import scanpy as sc sc.settings.preset = sc.Preset.ScanpyV1 adata = sc.datasets.pbmc68k_reduced() adata_hv = adata[:, adata.var["highly_variable"]].copy() sc.pl.ranking(adata_hv, attr="varm", keys="PCs", indices=[0, 1, 2])
Include the lowest-loading genes alongside the highest.
sc.pl.ranking(adata_hv, attr="varm", keys="PCs", indices=[0, 1, 2], include_lowest=True)