scanpy.pl.clustermap#
- scanpy.pl.clustermap(adata, obs_keys=None, *, use_raw=None, show=None, save=None, **kwds)[source]#
Hierarchically-clustered heatmap.
Wraps
seaborn.clustermap()forAnnData.- Parameters:
- adata
AnnData Annotated data matrix.
- obs_keys
str|None(default:None) Categorical annotation to plot with a different color map. Currently, only a single key is supported.
- use_raw
bool|None(default:None) Whether to use
rawattribute ofadata. Defaults toTrueif.rawis present.- show
bool|None(default:None) Show the plot, do not return axis.
- save
bool|str|None(default:None) If
Trueor astr, save the figure. A string is appended to the default filename. Infer the filetype if ending on {'.pdf','.png','.svg'}. (deprecated in favour ofsc.pl.plot(show=False).figure.savefig()).- ax
A matplotlib axes object. Only works if plotting a single component.
- **kwds
Keyword arguments passed to
clustermap().
- adata
- Return type:
ClusterGrid|None- Returns:
If
showisFalse, aClusterGridobject (seeclustermap()).
Examples
import scanpy as sc
adata = sc.datasets.krumsiek11()
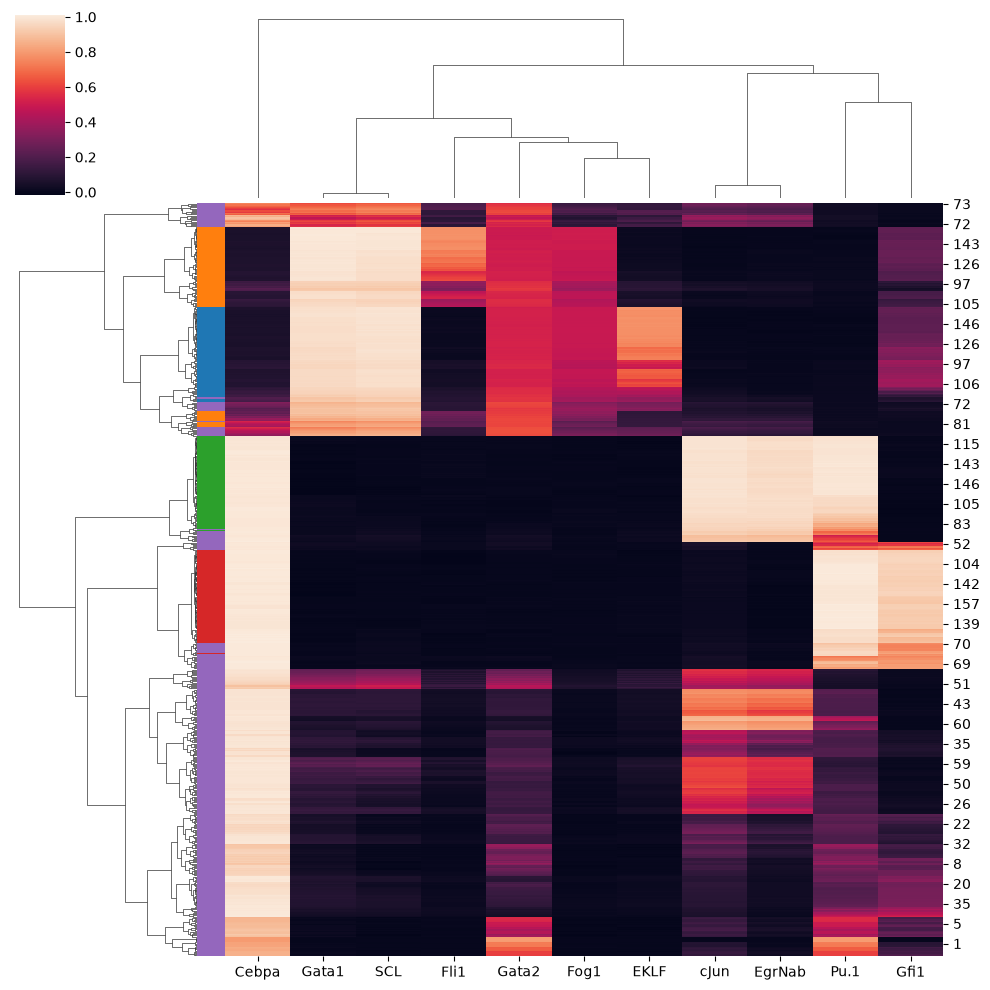
sc.pl.clustermap(adata)
/home/docs/checkouts/readthedocs.org/user_builds/icb-scanpy/checkouts/latest/src/scanpy/io/_read.py:740: UserWarning: Observation names are not unique. To make them unique, call `.obs_names_make_unique`.
  adata = read_text(filename, delimiter, first_column_names=first_column_names)
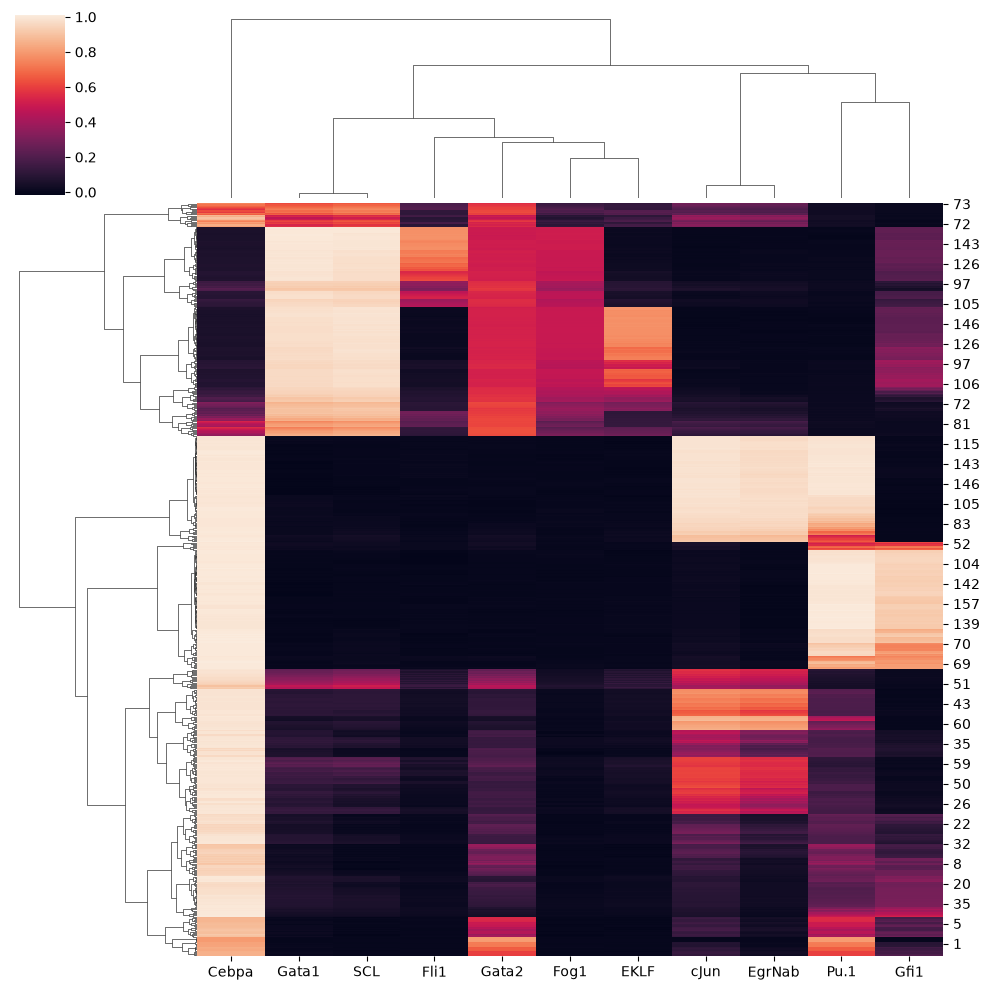
sc.pl.clustermap(adata, obs_keys='cell_type')