scanpy.pl.highly_variable_genes#
Note
Both backends are accessible as scanpy.pl.highly_variable_genes.
The active backend is chosen by scanpy.settings.preset:
the default is the legacy matplotlib backend;
set it to scanpy.Preset.ScanpyV2Preview to use the HoloViews backend.
- scanpy.plotting._v2.highly_variable_genes(adata)[source]
Plot dispersions used to identify highly variable genes.
- Parameters:
- adata
AnnData The AnnData object.
- adata
- Return type:
- Returns:
A layout containing two
Scatterplots, one normalized and one not.
Examples
import scanpy as sc

sc.settings.preset = sc.Preset.ScanpyV2Preview
A = sc.pl.hv_init('bokeh')

adata = sc.datasets.pbmc68k_reduced()
sc.pp.highly_variable_genes(adata, layer="counts")  # TODO: this should be the default
sc.pl.highly_variable_genes(adata)
/tmp/ipykernel_2131/1650608756.py:7: UserWarning: `flavor='seurat_v3_paper'` expects raw count data, but non-integers were found. sc.pp.highly_variable_genes(adata, layer="counts") # TODO: this should be the default
import scanpy as sc

sc.settings.preset = sc.Preset.ScanpyV2Preview
A = sc.pl.hv_init('matplotlib')

adata = sc.datasets.pbmc68k_reduced()
sc.pp.highly_variable_genes(adata, layer="counts")  # TODO: this should be the default
sc.pl.highly_variable_genes(adata)
/tmp/ipykernel_2131/1650608756.py:7: UserWarning: `flavor='seurat_v3_paper'` expects raw count data, but non-integers were found. sc.pp.highly_variable_genes(adata, layer="counts") # TODO: this should be the default

import scanpy as sc

sc.settings.preset = sc.Preset.ScanpyV2Preview
A = sc.pl.hv_init('plotly')

adata = sc.datasets.pbmc68k_reduced()
sc.pp.highly_variable_genes(adata, layer="counts")  # TODO: this should be the default
sc.pl.highly_variable_genes(adata)
/tmp/ipykernel_2131/1650608756.py:7: UserWarning: `flavor='seurat_v3_paper'` expects raw count data, but non-integers were found. sc.pp.highly_variable_genes(adata, layer="counts") # TODO: this should be the default WARNING:param.main: Option 'legend_labels' for Scatter type not valid for selected backend ('plotly'). Option only applies to following backends: ['bokeh', 'matplotlib'] WARNING:param.main: Option 'legend_position' for Scatter type not valid for selected backend ('plotly'). Option only applies to following backends: ['bokeh', 'matplotlib'] WARNING:param.main: Option 'legend_labels' for Scatter type not valid for selected backend ('plotly'). Option only applies to following backends: ['bokeh', 'matplotlib'] WARNING:param.main: Option 'legend_position' for Scatter type not valid for selected backend ('plotly'). Option only applies to following backends: ['bokeh', 'matplotlib']
- scanpy.pl.highly_variable_genes(adata_or_result, *, log=False, show=None, highly_variable_genes=True, save=None)[source]#
Plot dispersions or normalized variance versus means for genes.
Produces Supp. Fig. 5c of Zheng et al. (2017) and MeanVarPlot() and VariableFeaturePlot() of Seurat.
- Parameters:
- adata
Result of
highly_variable_genes().- log
bool(default:False) Plot on logarithmic axes.
- show
bool|None(default:None) Show the plot, do not return axis.
- save
bool|str|None(default:None) If
Trueor astr, save the figure. A string is appended to the default filename. Infer the filetype if ending on {{'.pdf','.png','.svg'}}.
- Return type:
Examples
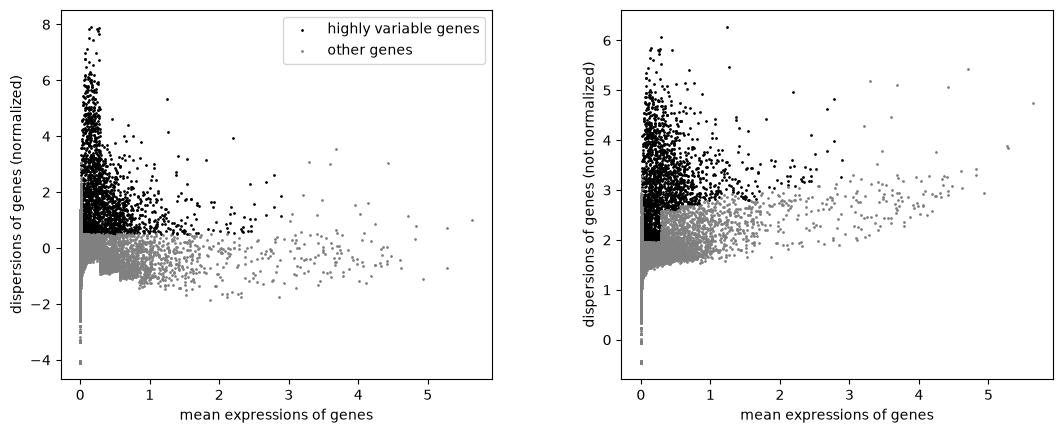
Compute and plot highly variable genes from raw PBMC data.
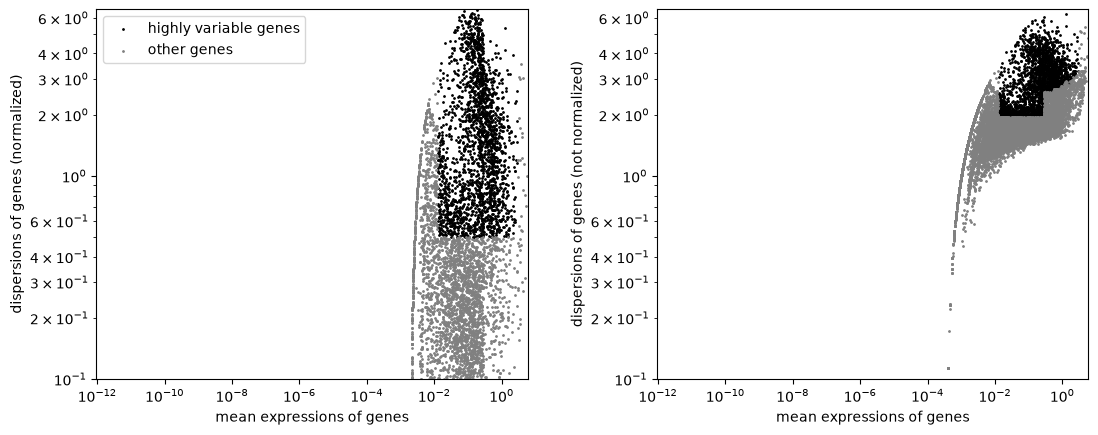
import scanpy as sc
sc.settings.preset = sc.Preset.ScanpyV1
adata = sc.datasets.pbmc3k()
sc.pp.normalize_total(adata, target_sum=1e4)
sc.pp.log1p(adata)
sc.pp.highly_variable_genes(adata, min_mean=0.0125, max_mean=3, min_disp=0.5)
sc.pl.highly_variable_genes(adata)
Plot on logarithmic axes.
sc.pl.highly_variable_genes(adata, log=True)