scanpy.pl.ranking#
- scanpy.pl.ranking(adata, attr, keys, *, dictionary=None, indices=None, labels=None, color='black', n_points=30, log=False, include_lowest=False, show=None)[source]#
Plot rankings.
See, for example, how this is used in pl.pca_loadings.
- Parameters:
- Return type:
- Returns:
Returns matplotlib gridspec with access to the axes.
Examples
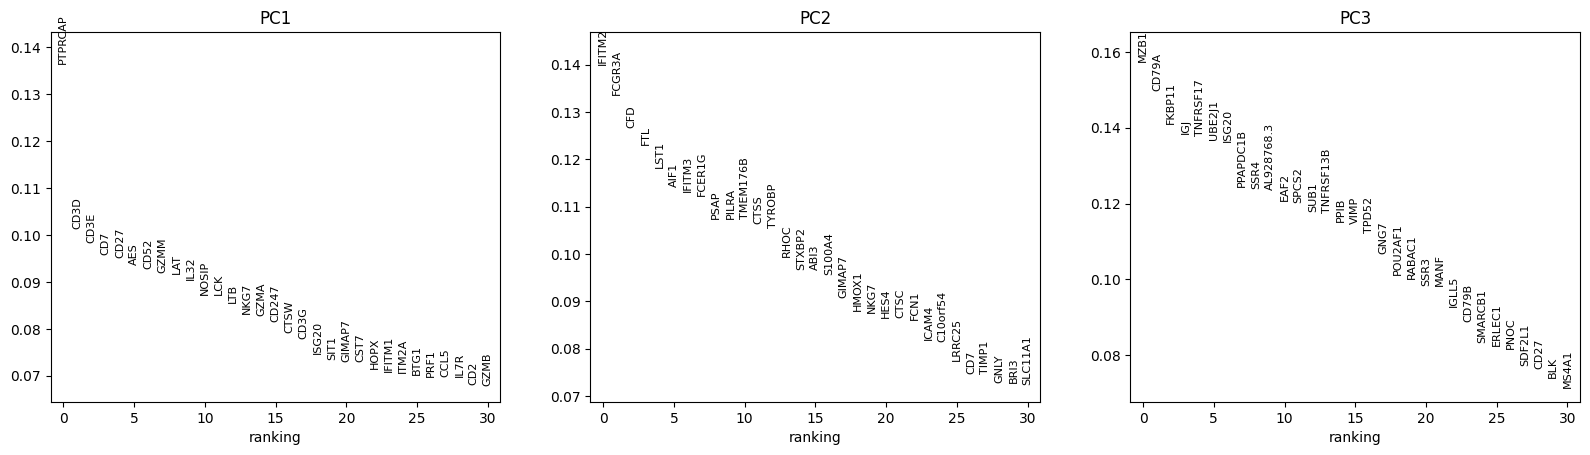
Show the genes with the highest loading on the first three principal components. PCA in
pbmc68k_reduced()was computed on highly-variable genes only, so we subset to those genes before ranking.import scanpy as sc adata = sc.datasets.pbmc68k_reduced() adata_hv = adata[:, adata.var["highly_variable"]].copy() sc.pl.ranking(adata_hv, attr="varm", keys="PCs", indices=[0, 1, 2])
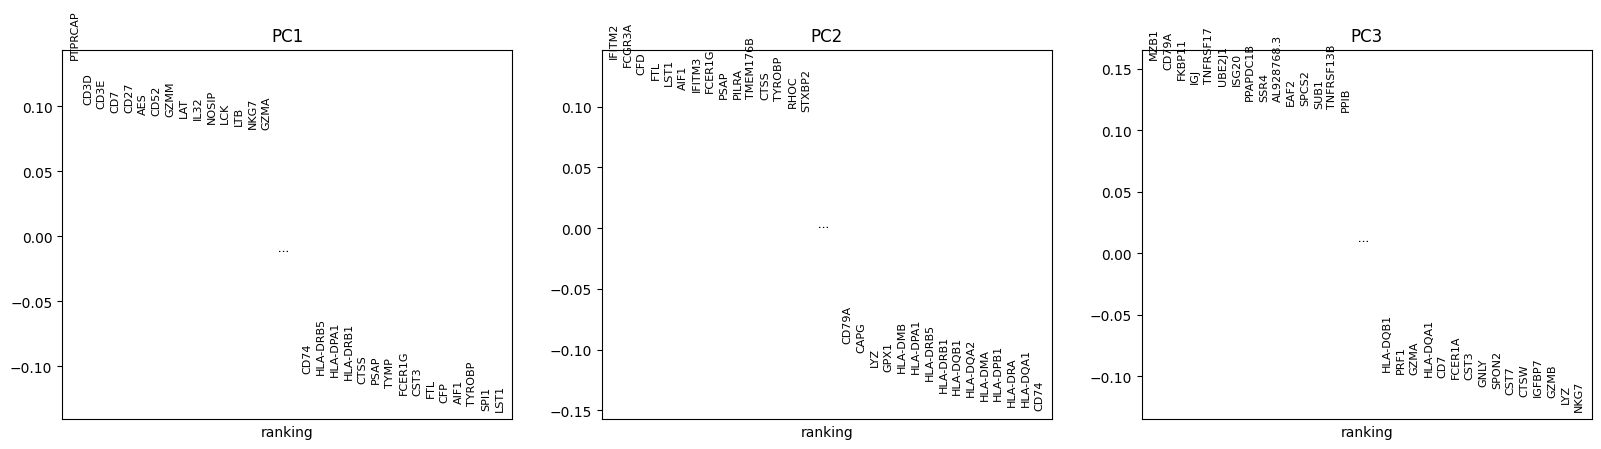
Include the lowest-loading genes alongside the highest.
sc.pl.ranking(adata_hv, attr="varm", keys="PCs", indices=[0, 1, 2], include_lowest=True)