scanpy.pl.rank_genes_groups#
- scanpy.pl.rank_genes_groups(adata, groups=None, *, n_genes=20, gene_symbols=None, key='rank_genes_groups', fontsize=8, ncols=4, sharey=True, show=None, ax=None, save=None, **kwds)[source]#
Plot ranking of genes.
- Parameters:
- adata
AnnData Annotated data matrix.
- groups
str|Sequence[str] |None(default:None) The groups for which to show the gene ranking.
- gene_symbols
str|None(default:None) Key for field in
.varthat stores gene symbols if you do not want to use.var_names.- n_genes
int(default:20) Number of genes to show.
- fontsize
int(default:8) Fontsize for gene names.
- ncols
int(default:4) Number of panels shown per row.
- sharey
bool(default:True) Controls if the y-axis of each panels should be shared. But passing
sharey=False, each panel has its own y-axis range.- show
bool|None(default:None) Show the plot, do not return axis.
- save
bool|None(default:None) If
Trueor astr, save the figure. A string is appended to the default filename. Infer the filetype if ending on {'.pdf','.png','.svg'}. (deprecated in favour ofsc.pl.plot(show=False).figure.savefig()).- ax
Axes|None(default:None) A matplotlib axes object. Only works if plotting a single component.
- adata
- Return type:
- Returns:
List of each group’s matplotlib axis or
Noneifshow=True.
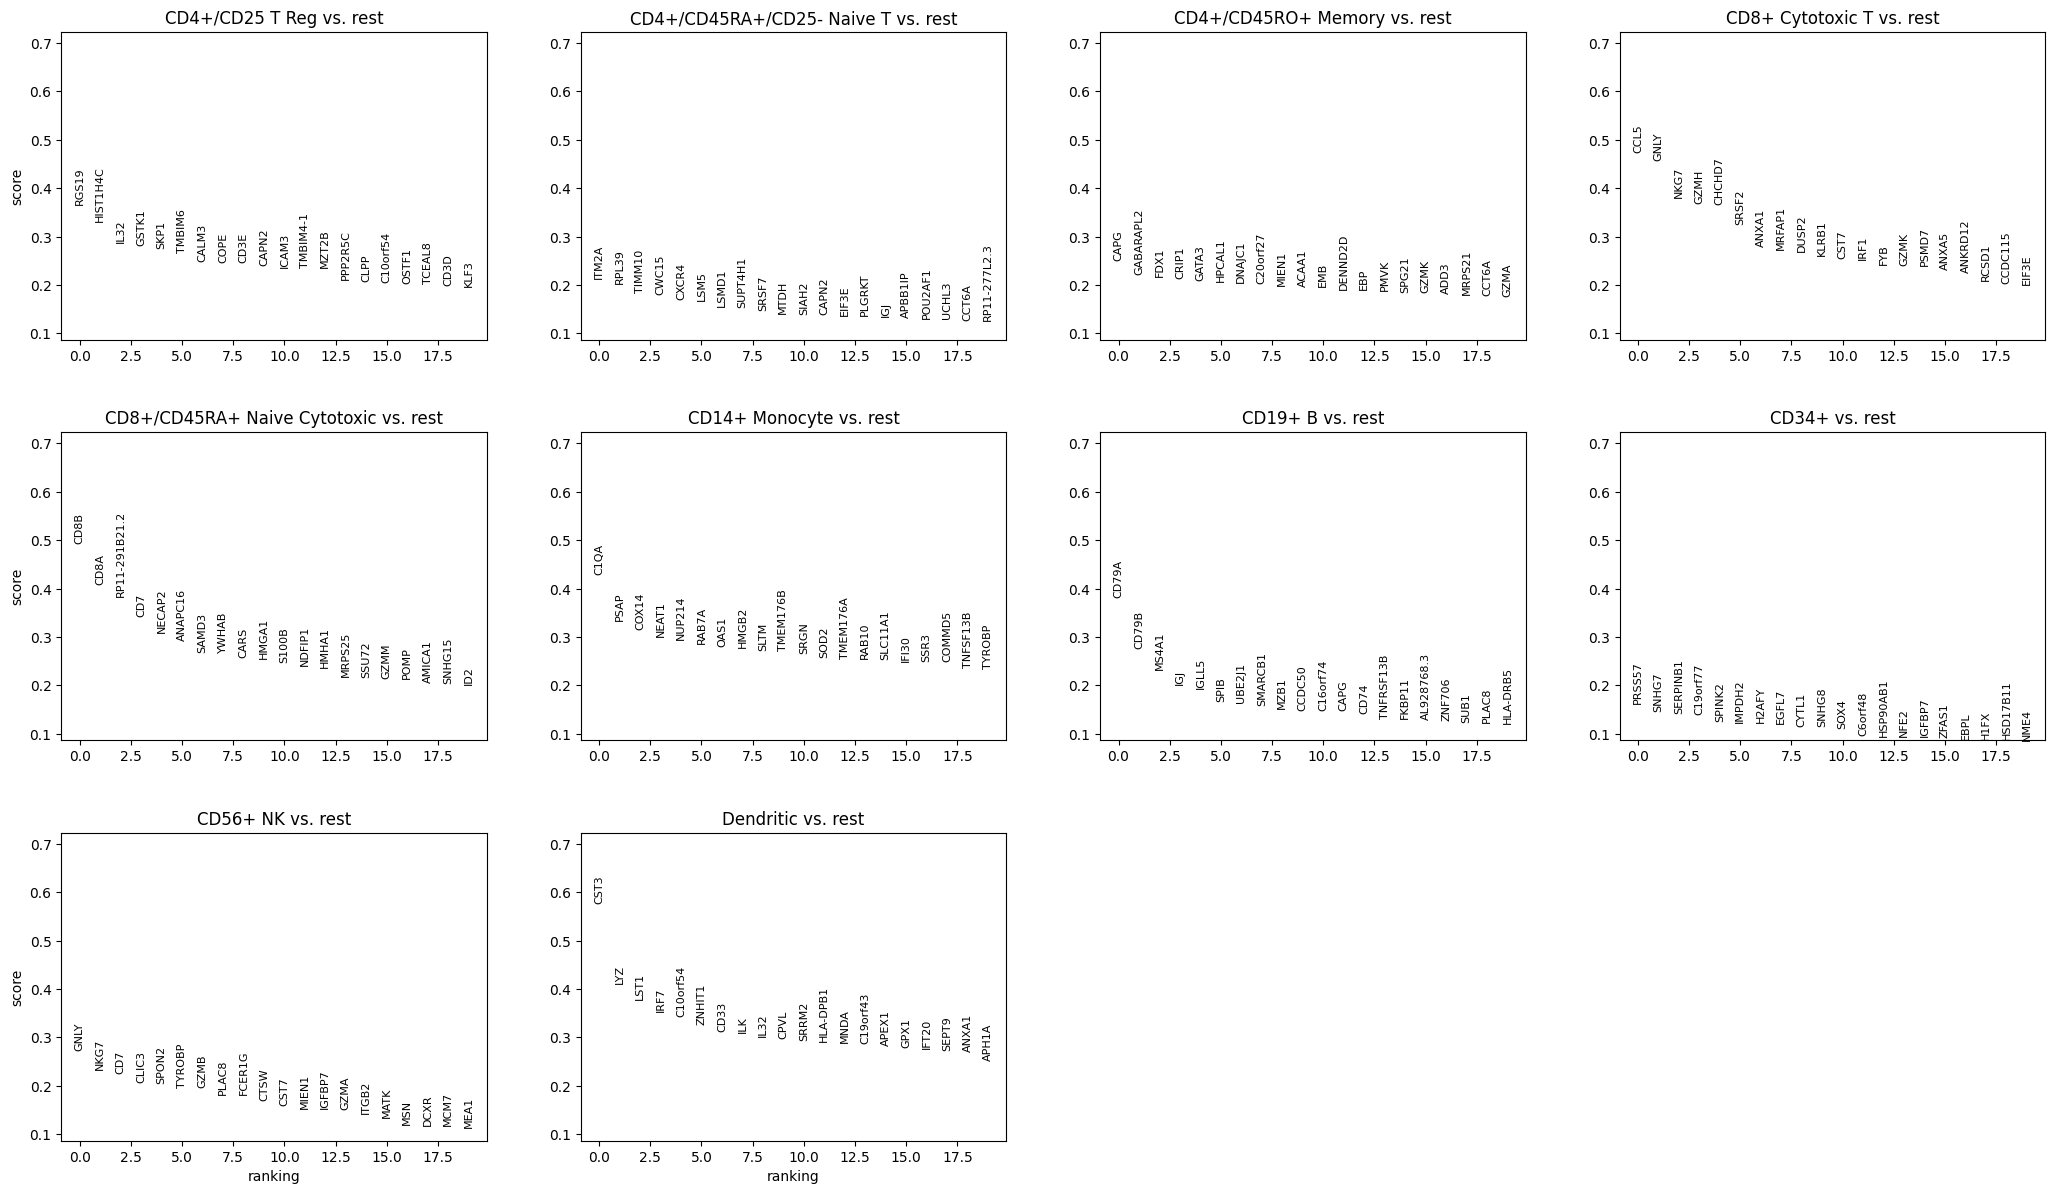
Examples
import scanpy as sc
adata = sc.datasets.pbmc68k_reduced()
sc.pl.rank_genes_groups(adata)
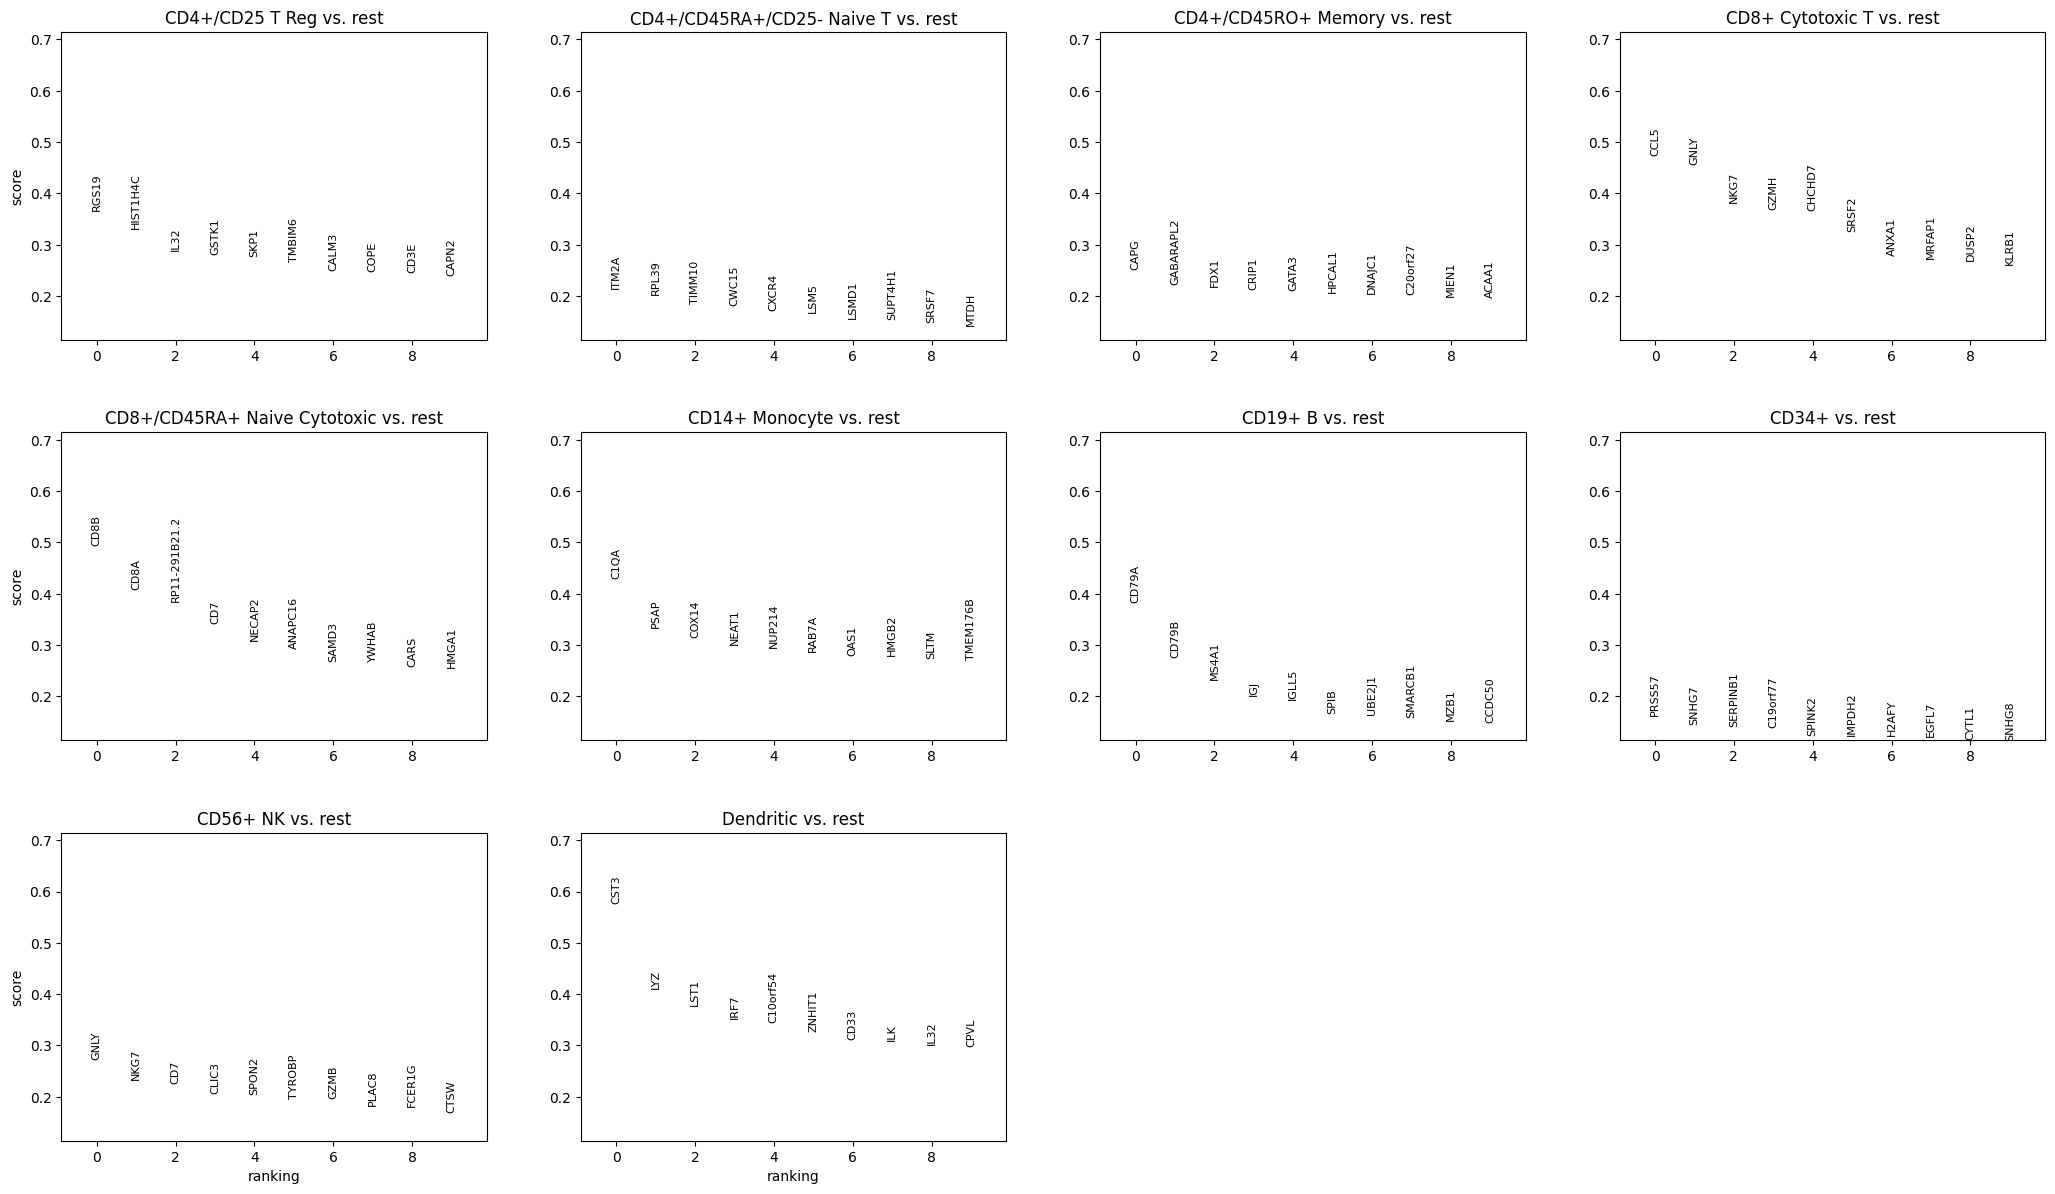
Plot top 10 genes (default 20 genes)
sc.pl.rank_genes_groups(adata, n_genes=10)
See also