scanpy.pl.dendrogram#
- scanpy.pl.dendrogram(adata, groupby, *, dendrogram_key=None, orientation='top', remove_labels=False, show=None, save=None, ax=None)[source]#
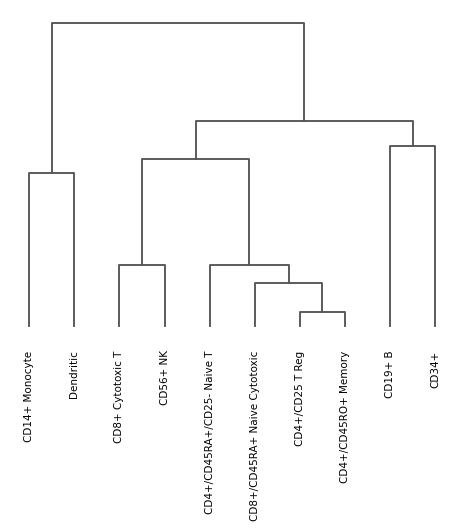
Plot a dendrogram of the categories defined in
groupby.See
dendrogram().- Parameters:
- adata
AnnData Annotated data matrix.
- groupby
str Categorical data column used to create the dendrogram
- dendrogram_key
str|None(default:None) Key under with the dendrogram information was stored. By default the dendrogram information is stored under
.uns[f'dendrogram_{groupby}'].- orientation
Literal['top','bottom','left','right'] (default:'top') Origin of the tree. Will grow into the opposite direction.
- remove_labels
bool(default:False) Don’t draw labels. Used e.g. by
scanpy.pl.matrixplot()to annotate matrix columns/rows.- show
bool|None(default:None) Show the plot, do not return axis.
- save
str|bool|None(default:None) If
Trueor astr, save the figure. A string is appended to the default filename. Infer the filetype if ending on {'.pdf','.png','.svg'}. (deprecated in favour ofsc.pl.plot(show=False).figure.savefig()).- ax
Axes|None(default:None) A matplotlib axes object. Only works if plotting a single component.
- adata
- Return type:
- Returns:
Examples
import scanpy as sc
adata = sc.datasets.pbmc68k_reduced()
sc.tl.dendrogram(adata, 'bulk_labels')
sc.pl.dendrogram(adata, 'bulk_labels')