scanpy.pl.paga_compare#
- scanpy.pl.paga_compare(adata, basis=None, *, edges=False, color=None, alpha=None, groups=None, components=None, projection='2d', legend_loc='on data', legend_fontsize=None, legend_fontweight='bold', legend_fontoutline=None, color_map=None, palette=None, frameon=False, size=None, title=None, right_margin=None, left_margin=0.05, show=None, save=None, title_graph=None, groups_graph=None, pos=None, **paga_graph_params)[source]#
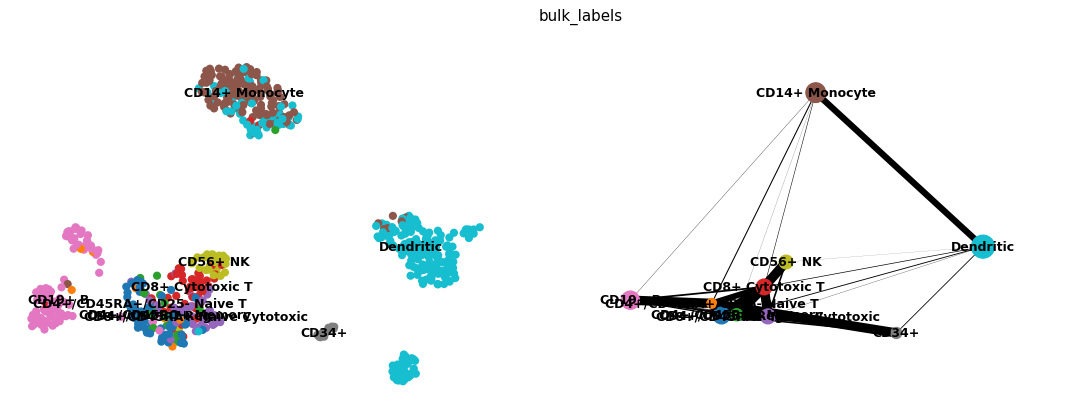
Scatter and PAGA graph side-by-side.
Consists in a scatter plot and the abstracted graph. See
paga()for all related parameters.See
paga_path()for visualizing gene changes along paths through the abstracted graph.Additional parameters are as follows.
- Parameters:
- Returns:
A list of
AxesifshowisFalse.
Examples
Compute a PAGA graph on the bundled PBMC dataset and show it next to the UMAP embedding.
import scanpy as sc
adata = sc.datasets.pbmc68k_reduced()
sc.tl.paga(adata, groups="bulk_labels")
sc.pl.paga_compare(adata, basis="umap")