scanpy.pl.highly_variable_genes#
- scanpy.pl.highly_variable_genes(adata_or_result, *, log=False, show=None, highly_variable_genes=True, save=None)[source]#
Plot dispersions or normalized variance versus means for genes.
Produces Supp. Fig. 5c of Zheng et al. (2017) and MeanVarPlot() and VariableFeaturePlot() of Seurat.
- Parameters:
- adata
Result of
highly_variable_genes().- log
bool(default:False) Plot on logarithmic axes.
- show
bool|None(default:None) Show the plot, do not return axis.
- save
bool|str|None(default:None) If
Trueor astr, save the figure. A string is appended to the default filename. Infer the filetype if ending on {{'.pdf','.png','.svg'}}.
- Return type:
Examples
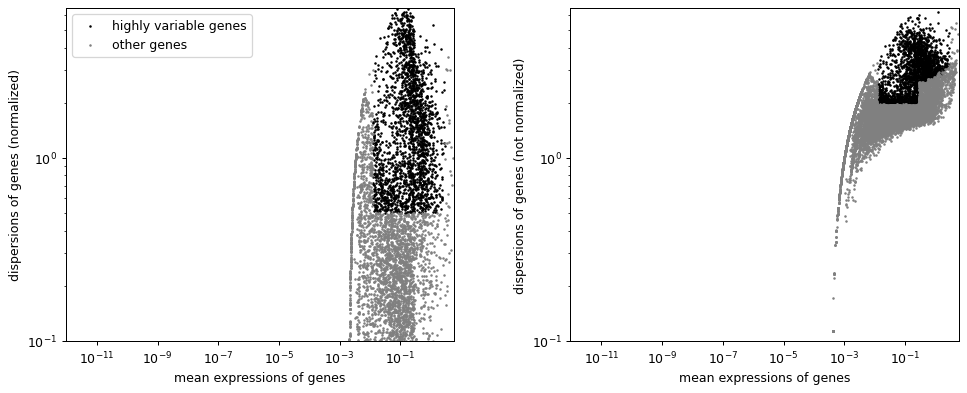
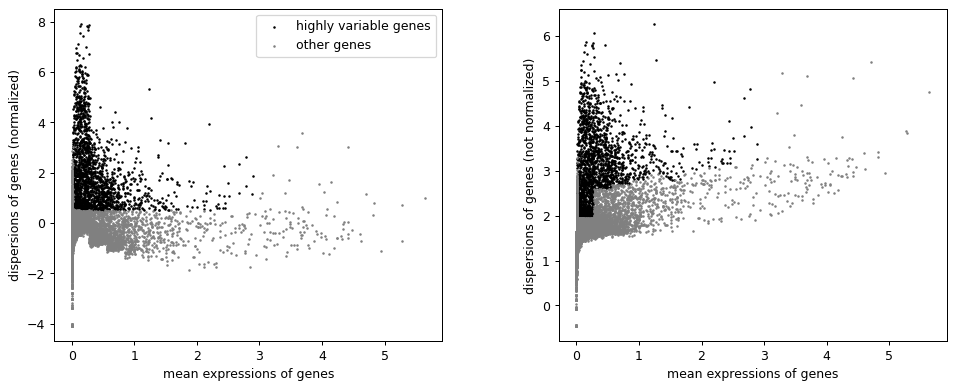
Compute and plot highly variable genes from raw PBMC data.
import scanpy as sc
adata = sc.datasets.pbmc3k()
sc.pp.normalize_total(adata, target_sum=1e4)
sc.pp.log1p(adata)
sc.pp.highly_variable_genes(adata, min_mean=0.0125, max_mean=3, min_disp=0.5)
sc.pl.highly_variable_genes(adata)
Plot on logarithmic axes.
sc.pl.highly_variable_genes(adata, log=True)