scanpy.pl.violin#
- scanpy.pl.violin(adata, keys, groupby=None, *, log=False, use_raw=None, stripplot=True, jitter=True, size=1, layer=None, density_norm='width', order=None, multi_panel=None, xlabel='', ylabel=None, rotation=None, show=None, save=None, ax=None, scale=_empty, **kwds)[source]#
Violin plot.
Wraps
seaborn.violinplot()forAnnData.- Parameters:
- adata
AnnData Annotated data matrix.
- keys
str|Sequence[str] Keys for accessing variables of
.var_namesor fields of.obs.- groupby
str|None(default:None) The key of the observation grouping to consider.
- log
bool(default:False) Plot on logarithmic axis.
- use_raw
bool|None(default:None) Whether to use
rawattribute ofadata. Defaults toTrueif.rawis present.- stripplot
bool(default:True) Add a stripplot on top of the violin plot. See
stripplot().- jitter
float|bool(default:True) Add jitter to the stripplot (only when stripplot is True) See
stripplot().- size
int(default:1) Size of the jitter points.
- layer
str|None(default:None) Name of the AnnData object layer that wants to be plotted. By default adata.raw.X is plotted. If
use_raw=Falseis set, thenadata.Xis plotted. Iflayeris set to a valid layer name, then the layer is plotted.layertakes precedence overuse_raw.- density_norm
Literal['area','count','width'] (default:'width') The method used to scale the width of each violin. If ‘width’ (the default), each violin will have the same width. If ‘area’, each violin will have the same area. If ‘count’, a violin’s width corresponds to the number of observations.
- order
Sequence[str] |None(default:None) Order in which to show the categories.
- multi_panel
bool|None(default:None) Display keys in multiple panels also when
groupby is not None.- xlabel
str(default:'') Label of the x axis. Defaults to
groupbyifrotationisNone, otherwise, no label is shown.- ylabel
str|Sequence[str] |None(default:None) Label of the y axis. If
NoneandgroupbyisNone, defaults to'value'. IfNoneandgroubpyis notNone, defaults tokeys.- rotation
float|None(default:None) Rotation of xtick labels.
- show
bool|None(default:None) Show the plot, do not return axis.
- save
bool|str|None(default:None) If
Trueor astr, save the figure. A string is appended to the default filename. Infer the filetype if ending on {'.pdf','.png','.svg'}.- ax
Axes|None(default:None) A matplotlib axes object. Only works if plotting a single component.
- **kwds
Are passed to
violinplot().
- adata
- Return type:
- Returns:
A
Axesobject ifaxisNoneelseNone.
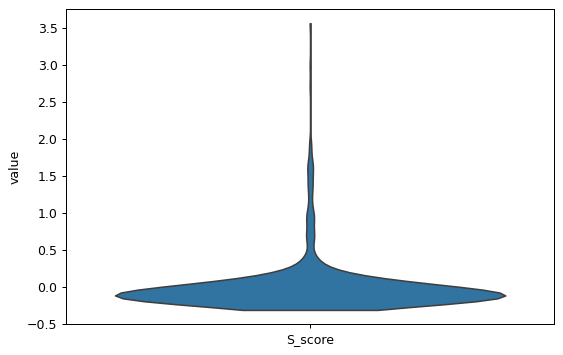
Examples
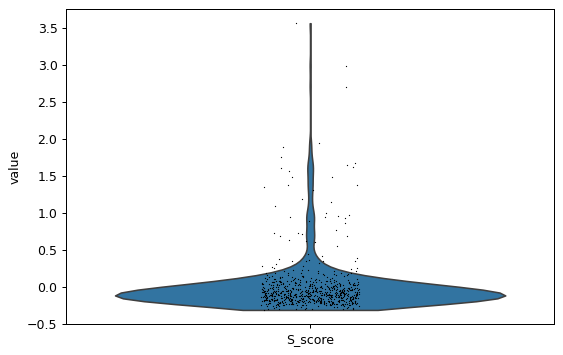
import scanpy as sc
adata = sc.datasets.pbmc68k_reduced()
sc.pl.violin(adata, keys='S_score')
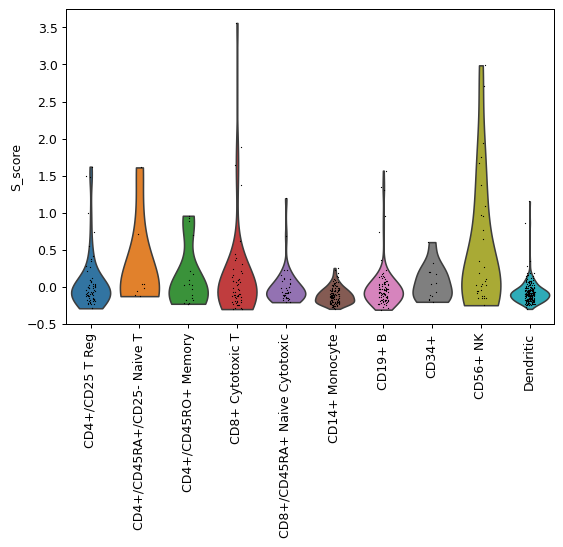
Plot by category. Rotate x-axis labels so that they do not overlap.
sc.pl.violin(adata, keys='S_score', groupby='bulk_labels', rotation=90)
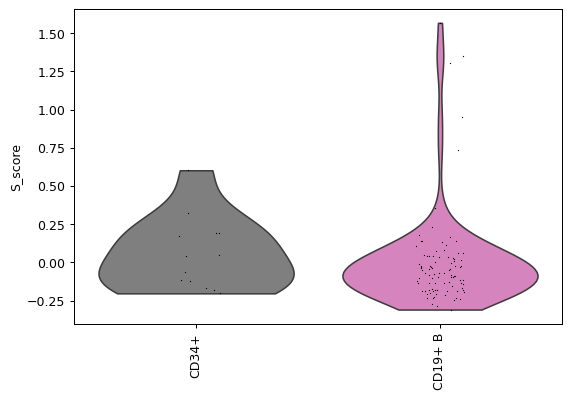
Set order of categories to be plotted or select specific categories to be plotted.
groupby_order = ['CD34+', 'CD19+ B']
sc.pl.violin(adata, keys='S_score', groupby='bulk_labels', rotation=90,
    order=groupby_order)
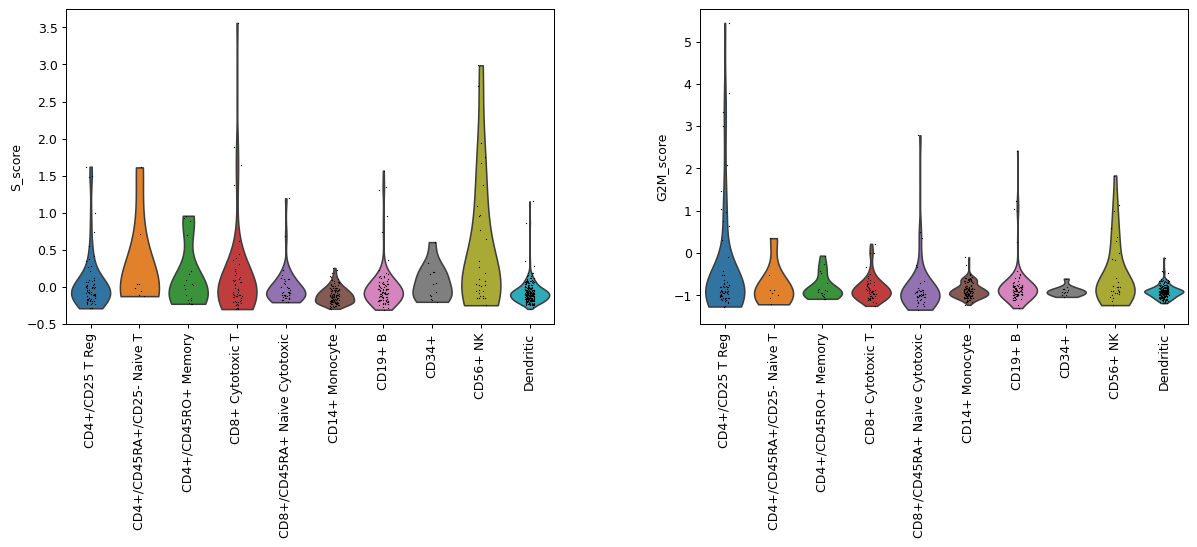
Plot multiple keys.
sc.pl.violin(adata, keys=['S_score', 'G2M_score'], groupby='bulk_labels',
    rotation=90)
For large datasets consider omitting the overlaid scatter plot.
sc.pl.violin(adata, keys='S_score', stripplot=False)
See also