scanpy.pl.matrixplot
- scanpy.pl.matrixplot(adata, var_names, groupby, use_raw=None, log=False, num_categories=7, figsize=None, dendrogram=False, title=None, cmap='viridis', colorbar_title='Mean expression\\nin group', gene_symbols=None, var_group_positions=None, var_group_labels=None, var_group_rotation=None, layer=None, standard_scale=None, values_df=None, swap_axes=False, show=None, save=None, ax=None, return_fig=False, vmin=None, vmax=None, vcenter=None, norm=None, **kwds)
Creates a heatmap of the mean expression values per group of each var_names.
This function provides a convenient interface to the
MatrixPlotclass. If you need more flexibility, you should useMatrixPlotdirectly.- Parameters:
- adata :
AnnData Annotated data matrix.
- var_names :
Union[str,Sequence[str],Mapping[str,Union[str,Sequence[str]]]] var_namesshould be a valid subset ofadata.var_names. Ifvar_namesis a mapping, then the key is used as label to group the values (seevar_group_labels). The mapping values should be sequences of validadata.var_names. In this case either coloring or ‘brackets’ are used for the grouping of var names depending on the plot. Whenvar_namesis a mapping, then thevar_group_labelsandvar_group_positionsare set.- groupby :
Union[str,Sequence[str]] The key of the observation grouping to consider.
- use_raw :
Optional[bool] (default:None) Use
rawattribute ofadataif present.- log :
bool(default:False) Plot on logarithmic axis.
- num_categories :
int(default:7) Only used if groupby observation is not categorical. This value determines the number of groups into which the groupby observation should be subdivided.
- categories_order
Order in which to show the categories. Note: add_dendrogram or add_totals can change the categories order.
- figsize :
Optional[Tuple[float,float]] (default:None) Figure size when
multi_panel=True. Otherwise thercParam['figure.figsize]value is used. Format is (width, height)- dendrogram :
Union[bool,str] (default:False) If True or a valid dendrogram key, a dendrogram based on the hierarchical clustering between the
groupbycategories is added. The dendrogram information is computed usingscanpy.tl.dendrogram(). Iftl.dendrogramhas not been called previously the function is called with default parameters.- gene_symbols :
Optional[str] (default:None) Column name in
.varDataFrame that stores gene symbols. By defaultvar_namesrefer to the index column of the.varDataFrame. Setting this option allows alternative names to be used.- var_group_positions :
Optional[Sequence[Tuple[int,int]]] (default:None) Use this parameter to highlight groups of
var_names. This will draw a ‘bracket’ or a color block between the given start and end positions. If the parametervar_group_labelsis set, the corresponding labels are added on top/left. E.g.var_group_positions=[(4,10)]will add a bracket between the fourthvar_nameand the tenthvar_name. By giving more positions, more brackets/color blocks are drawn.- var_group_labels :
Optional[Sequence[str]] (default:None) Labels for each of the
var_group_positionsthat want to be highlighted.- var_group_rotation :
Optional[float] (default:None) Label rotation degrees. By default, labels larger than 4 characters are rotated 90 degrees.
- layer :
Optional[str] (default:None) Name of the AnnData object layer that wants to be plotted. By default adata.raw.X is plotted. If
use_raw=Falseis set, thenadata.Xis plotted. Iflayeris set to a valid layer name, then the layer is plotted.layertakes precedence overuse_raw.- title :
Optional[str] (default:None) Title for the figure
- colorbar_title :
Optional[str] (default:'Mean expression\\nin group') Title for the color bar. New line character (n) can be used.
- cmap :
Optional[str] (default:'viridis') String denoting matplotlib color map.
- standard_scale :
Optional[Literal['var','group']] (default:None) Whether or not to standardize the given dimension between 0 and 1, meaning for each variable or group, subtract the minimum and divide each by its maximum.
- swap_axes :
bool(default:False) By default, the x axis contains
var_names(e.g. genes) and the y axis thegroupbycategories. By settingswap_axesthen x are thegroupbycategories and y thevar_names.- return_fig :
Optional[bool] (default:False) Returns
DotPlotobject. Useful for fine-tuning the plot. Takes precedence overshow=False.- show :
Optional[bool] (default:None) Show the plot, do not return axis.
- save :
Union[str,bool,None] (default:None) If
Trueor astr, save the figure. A string is appended to the default filename. Infer the filetype if ending on {'.pdf','.png','.svg'}.- ax :
Optional[_AxesSubplot] (default:None) A matplotlib axes object. Only works if plotting a single component.
- vmin :
Optional[float] (default:None) The value representing the lower limit of the color scale. Values smaller than vmin are plotted with the same color as vmin.
- vmax :
Optional[float] (default:None) The value representing the upper limit of the color scale. Values larger than vmax are plotted with the same color as vmax.
- vcenter :
Optional[float] (default:None) The value representing the center of the color scale. Useful for diverging colormaps.
- norm :
Optional[Normalize] (default:None) Custom color normalization object from matplotlib. See
https://matplotlib.org/stable/tutorials/colors/colormapnorms.htmlfor details.- kwds
Are passed to
matplotlib.pyplot.pcolor().
- adata :
- Return type:
Union[MatrixPlot,dict,None]- Returns:
: If
return_figisTrue, returns aMatrixPlotobject, else ifshowis false, return axes dict
See also
MatrixPlotThe MatrixPlot class can be used to to control several visual parameters not available in this function.
rank_genes_groups_matrixplot()to plot marker genes identified using the
rank_genes_groups()function.
Examples
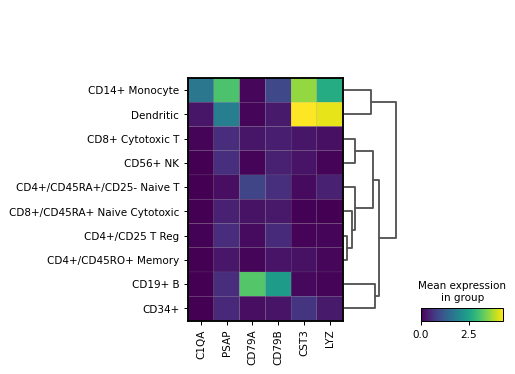
import scanpy as sc
adata = sc.datasets.pbmc68k_reduced()
markers = ['C1QA', 'PSAP', 'CD79A', 'CD79B', 'CST3', 'LYZ']
sc.pl.matrixplot(adata, markers, groupby='bulk_labels', dendrogram=True)
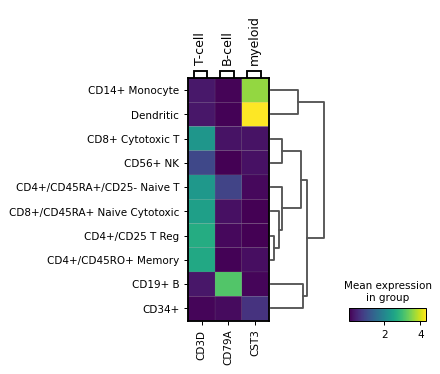
Using var_names as dict:
markers = {'T-cell': 'CD3D', 'B-cell': 'CD79A', 'myeloid': 'CST3'}
sc.pl.matrixplot(adata, markers, groupby='bulk_labels', dendrogram=True)
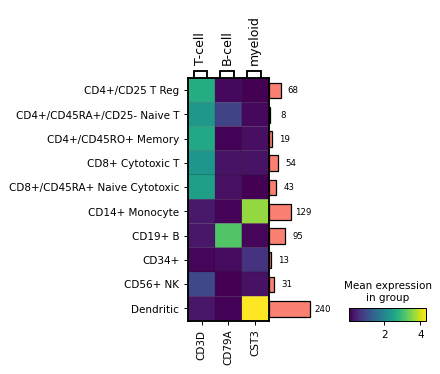
Get Matrix object for fine tuning:
mp = sc.pl.matrixplot(adata, markers, 'bulk_labels', return_fig=True)
mp.add_totals().style(edge_color='black').show()
The axes used can be obtained using the get_axes() method
axes_dict = mp.get_axes()