Tutorials
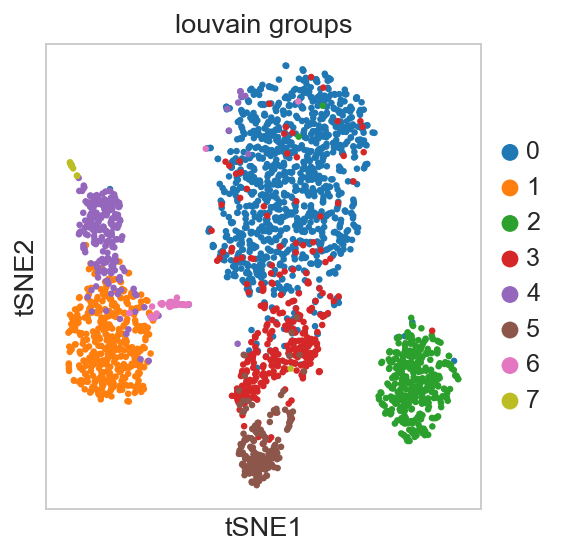
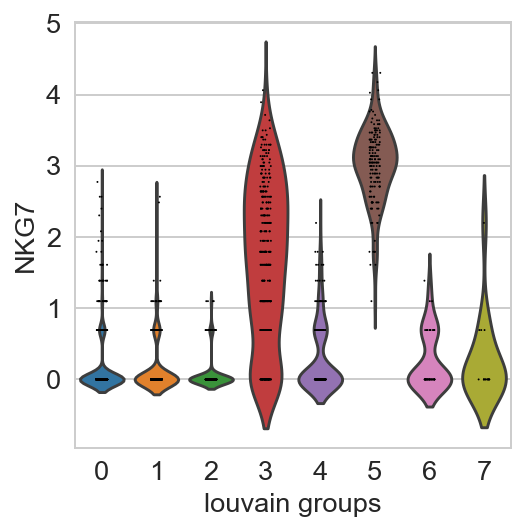
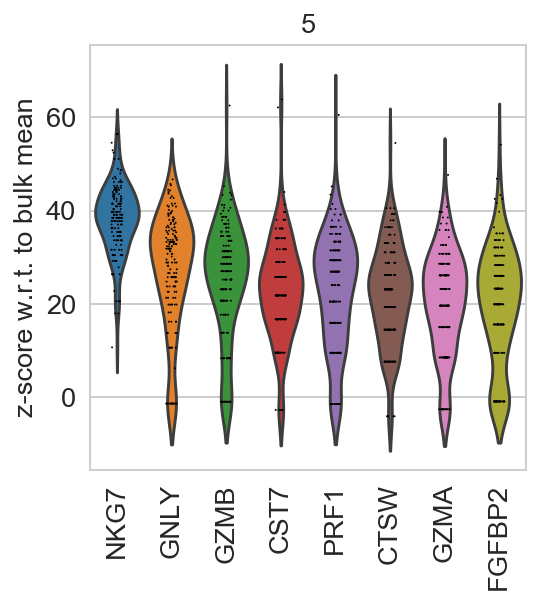
Clustering
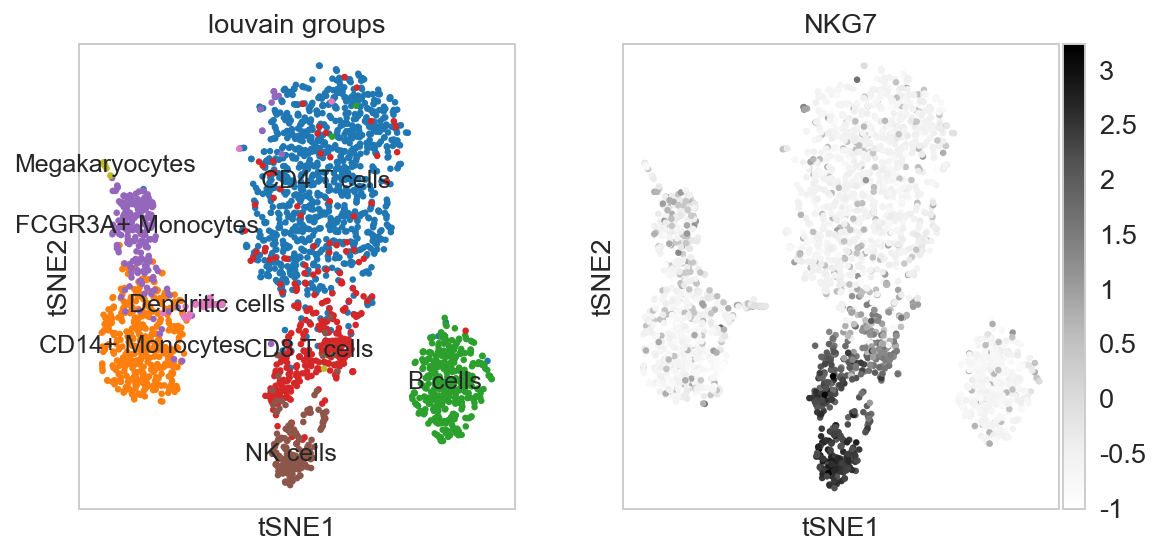
For getting started, we recommend Scanpy’s reimplementation → tutorial: pbmc3k of Seurat’s [Satija15] clustering tutorial for 3k PBMCs from 10x Genomics, containing preprocessing, clustering and the identification of cell types via known marker genes.
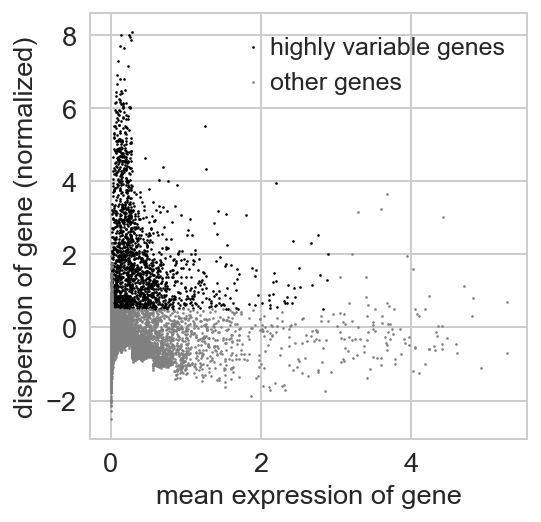
Visualization
This tutorial shows how to visually explore genes using scanpy. → tutorial: plotting/core

Trajectory inference
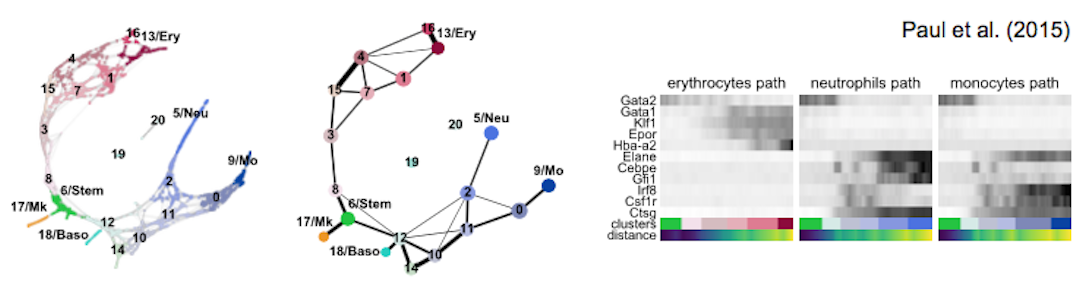
Get started with the following example for hematopoiesis for data of [Paul15]: → tutorial: paga-paul15
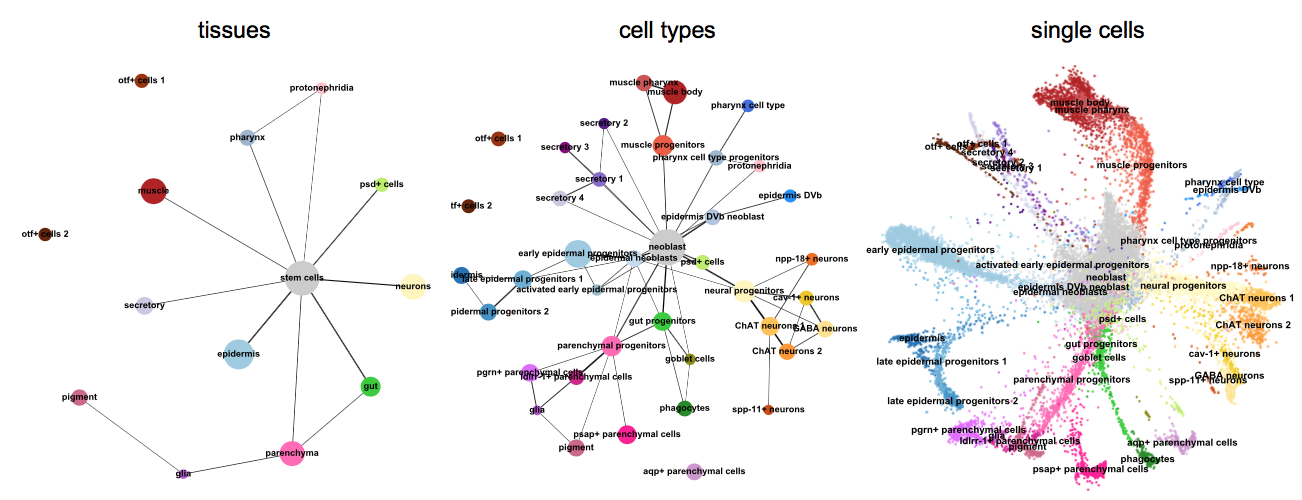
More examples for trajectory inference on complex datasets can be found in the PAGA repository [Wolf19], for instance, multi-resolution analyses of whole animals, such as for planaria for data of [Plass18].
As a reference for simple pseudotime analyses, we provide the diffusion pseudotime (DPT) analyses of [Haghverdi16] for two hematopoiesis datasets: DPT example 1 [Paul15] and DPT example 2 [Moignard15].
Integrating datasets
Map labels and embeddings of reference data to new data: → tutorial: integrating-data-using-ingest

Spatial data
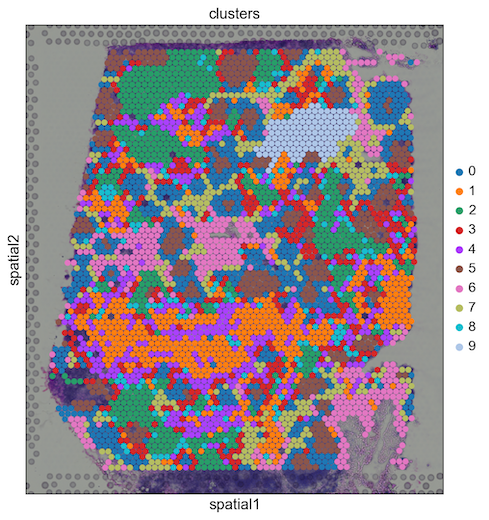
Basic analysis of spatial data: → tutorial: spatial/basic-analysis
Integrating spatial data with scRNA-seq using scanorama: → tutorial: spatial/integration-scanorama
Further Tutorials
Conversion: AnnData, SingleCellExperiment, and Seurat objects
See Seurat to AnnData for a tutorial on
anndata2ri.See the Scanpy in R guide for a tutorial on interacting with Scanpy from R.
Regressing out cell cycle
See the cell cycle notebook.
Scaling Computations
Visualize and cluster 1.3M neurons from 10x Genomics.
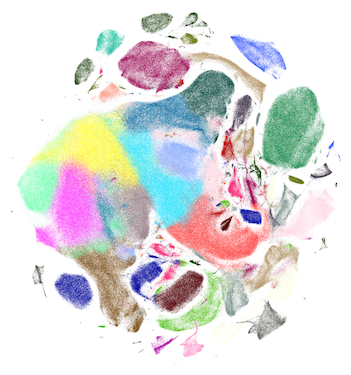
Simulations
Simulating single cells using literature-curated gene regulatory networks [Wittmann09].
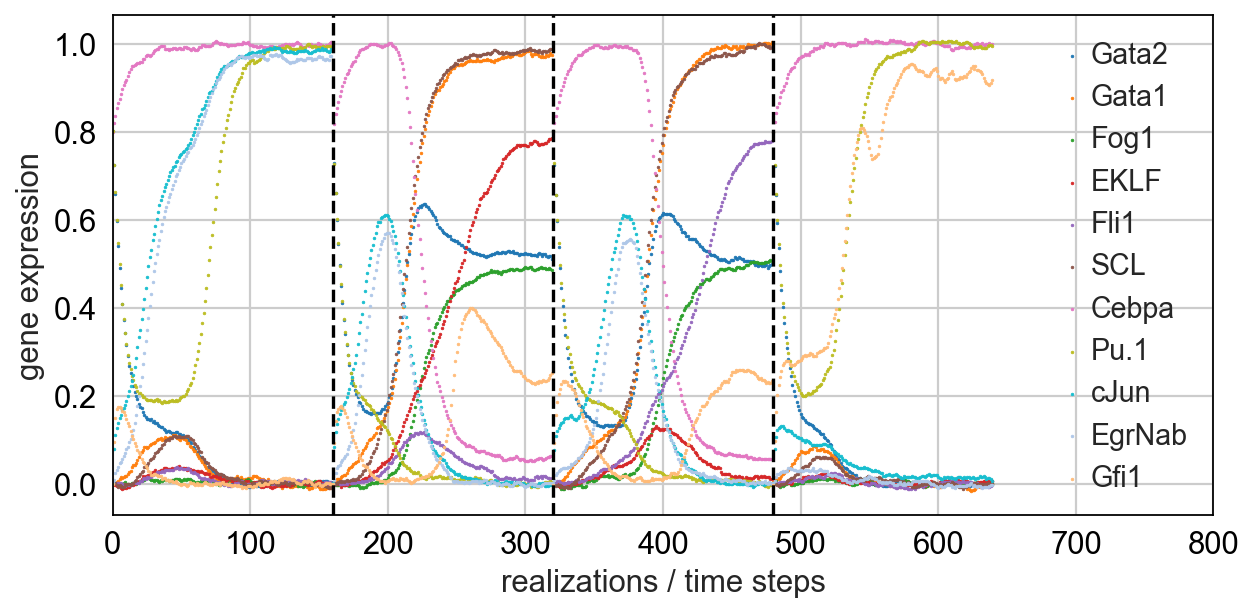
Notebook for myeloid differentiation
Notebook for simple toggleswitch
Images
See pseudotime-time inference on deep-learning based features for cell cycle reconstruction from image data [Eulenberg17].